This discussion is locked.
You cannot post a reply to this discussion. If you have a question start a new discussion

London Electric Vehicle Chargers Proposal.

How many?

https://www.dailymail.co.uk/money/cars/article-7150191/London-need-50-000-public-electric-car-chargers-2025.html


Z.
Parents
  • Wally, ‘Well, it's always possible to dismiss any scientific knowledge if you try hard enough’
    The AGW group are very good at this. If the science doesn’t agree with you use hype and scaremongering.
    I wrote this piece in response to ‘The Engineer’ poll on language and the climate which was based on the Guardian Editor’s instruction to ‘Hype Up’ climate change. As expected it did not pass the moderators. I have tried to use the best sources I could find ( In this forum I can directly include the pictures)
    www.theengineer.co.uk/.../
    --------------------------------------------------------------------------------------------------------------------------------------
    The climate has changed, is changing, and will continue to change with or without us. What do we actually know?
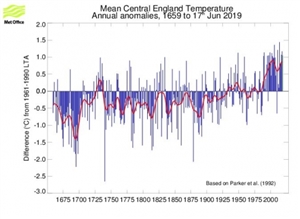
    The longest directly measured temperature series is the Central England series held by the UK Met office:
    https://www.metoffice.gov.uk/hadobs/hadcet/
    68bcdda909b499820783a56c347224ae-huge-hadcet-2019.jpg

    If you look at the chart, the temperature rose by more than 1.5°C between about 1700 and 1730. The temperature rose around 1°C between about 1975 and 2000. Were both of these man made? Were both of them natural? How do the climate models explain the rise in the 1700s.
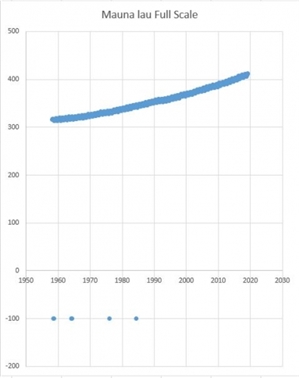
    The longest measured CO2 series is from Mauna Loa:
    https://www.esrl.noaa.gov/gmd/ccgg/trends/full.html
    This is always shown with an offset zero. It is a fairly trivial task to import the raw data and draw a ‘normal’ graph starting at zero. Much less scary.

    3e9582050bce238d059bdcf5089cae6b-huge-mauna-loa-full-scale.jpg

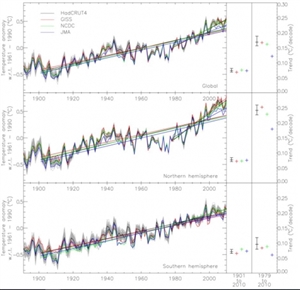
    What about global temperatures? There are several series available. As this is a UK magazine I will use the ones from the Met office:
    https://www.metoffice.gov.uk/hadobs/hadcrut4/figures/Figure11.png

    f95f77dc1ad4c0ab15046a656ee22cae-huge-hadcrut.jpg

    What do we see on these graphs? Firstly the various temperature series are in reasonable agreement. Secondly they only go back to 1900. If you look at the Central England series quite a lot happened before then. There is also a significant difference between the north and south hemispheres. For the northern hemisphere there is somewhat dubious attempt to show an increasing rate of temperature rise by starting from a cool spell in the 1970s.
    Does anything look scary enough to justify all this ‘Climate Emergency’ language?
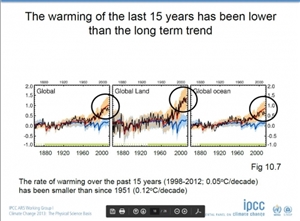
    The next graphs comes from the IPCC AR5 Working Group 1, The Physical Science Basis:
    http://www.climatechange2013.org/images/uploads/hartmann13agu_U22A_final.pdf

    1027c1ab184bafb5fcbeedb08da540a3-huge-ipcc-ar5-working-group-1.jpg

    On page 18 it shows the model outputs in red with a confidence band. Measured temperatures are black. The measure temperatures are always below the model and are starting to leave the confidence band. It also records the reduction in the rate of warming after 1998.
    Is reality scary or is it just the models?
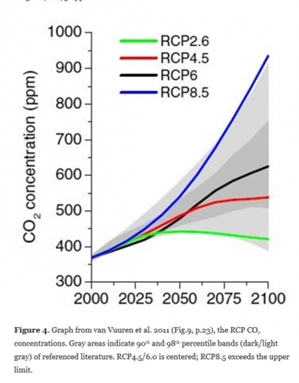
    The IPCC uses four scenarios, RCP2.6, RCP4.5, RCP6.0 and RCP8.5. RCP8.5 is the worst case and it has been suggested it could be difficult to dig coal fast enough to achieve it. Most of the scaremongering is based on this scenario. RCP6.0 is around business as usual, RCP4.5 is if an effort is made to reduce CO2 emissions and RCP2.6 is an unlikely best case.
    This is shown graphically in this article:
    https://judithcurry.com/2019/01/28/reassessing-the-rcps/
    Figure 4 shows it quite well.

    b048b2d35b7cbad12897382e9b894ea3-huge-curry-fig-4.jpg

    So does Climate Change deserve scary language? In my view no. What is important is reduction in the use of finite resources, reduction in change of land use and sustainable use of natural resources such as fish.

    -----------------------------------------------------------------------------------------------------------------------------------------------------------------------------------------------------------------------------------

    If you can offer any better science I will enjoy studying it.

    Best regards

    Roger


Reply
  • Wally, ‘Well, it's always possible to dismiss any scientific knowledge if you try hard enough’
    The AGW group are very good at this. If the science doesn’t agree with you use hype and scaremongering.
    I wrote this piece in response to ‘The Engineer’ poll on language and the climate which was based on the Guardian Editor’s instruction to ‘Hype Up’ climate change. As expected it did not pass the moderators. I have tried to use the best sources I could find ( In this forum I can directly include the pictures)
    www.theengineer.co.uk/.../
    --------------------------------------------------------------------------------------------------------------------------------------
    The climate has changed, is changing, and will continue to change with or without us. What do we actually know?
    The longest directly measured temperature series is the Central England series held by the UK Met office:
    https://www.metoffice.gov.uk/hadobs/hadcet/
    68bcdda909b499820783a56c347224ae-huge-hadcet-2019.jpg

    If you look at the chart, the temperature rose by more than 1.5°C between about 1700 and 1730. The temperature rose around 1°C between about 1975 and 2000. Were both of these man made? Were both of them natural? How do the climate models explain the rise in the 1700s.
    The longest measured CO2 series is from Mauna Loa:
    https://www.esrl.noaa.gov/gmd/ccgg/trends/full.html
    This is always shown with an offset zero. It is a fairly trivial task to import the raw data and draw a ‘normal’ graph starting at zero. Much less scary.

    3e9582050bce238d059bdcf5089cae6b-huge-mauna-loa-full-scale.jpg

    What about global temperatures? There are several series available. As this is a UK magazine I will use the ones from the Met office:
    https://www.metoffice.gov.uk/hadobs/hadcrut4/figures/Figure11.png

    f95f77dc1ad4c0ab15046a656ee22cae-huge-hadcrut.jpg

    What do we see on these graphs? Firstly the various temperature series are in reasonable agreement. Secondly they only go back to 1900. If you look at the Central England series quite a lot happened before then. There is also a significant difference between the north and south hemispheres. For the northern hemisphere there is somewhat dubious attempt to show an increasing rate of temperature rise by starting from a cool spell in the 1970s.
    Does anything look scary enough to justify all this ‘Climate Emergency’ language?
    The next graphs comes from the IPCC AR5 Working Group 1, The Physical Science Basis:
    http://www.climatechange2013.org/images/uploads/hartmann13agu_U22A_final.pdf

    1027c1ab184bafb5fcbeedb08da540a3-huge-ipcc-ar5-working-group-1.jpg

    On page 18 it shows the model outputs in red with a confidence band. Measured temperatures are black. The measure temperatures are always below the model and are starting to leave the confidence band. It also records the reduction in the rate of warming after 1998.
    Is reality scary or is it just the models?
    The IPCC uses four scenarios, RCP2.6, RCP4.5, RCP6.0 and RCP8.5. RCP8.5 is the worst case and it has been suggested it could be difficult to dig coal fast enough to achieve it. Most of the scaremongering is based on this scenario. RCP6.0 is around business as usual, RCP4.5 is if an effort is made to reduce CO2 emissions and RCP2.6 is an unlikely best case.
    This is shown graphically in this article:
    https://judithcurry.com/2019/01/28/reassessing-the-rcps/
    Figure 4 shows it quite well.

    b048b2d35b7cbad12897382e9b894ea3-huge-curry-fig-4.jpg

    So does Climate Change deserve scary language? In my view no. What is important is reduction in the use of finite resources, reduction in change of land use and sustainable use of natural resources such as fish.

    -----------------------------------------------------------------------------------------------------------------------------------------------------------------------------------------------------------------------------------

    If you can offer any better science I will enjoy studying it.

    Best regards

    Roger


Children
No Data