This discussion is locked.
You cannot post a reply to this discussion. If you have a question start a new discussion

E&T 'UK climate change sceptics group is stronger than ever' More from the Ministry of Truth

I had a look through the E&T article 'UK climate change sceptics group is stronger than ever'

https://eandt.theiet.org/content/articles/2020/01/top-uk-climate-change-sceptics-group-is-stronger-than-ever/

This article seems to be simply alarmist propaganda which is generally incorrect. To pick a few examples.
It is written:

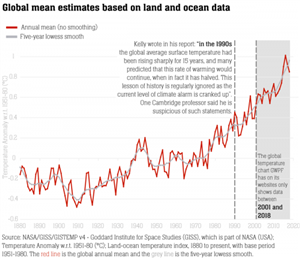
On page 18 of the lecture document Kelly wrote: ”In the 1990s the global average surface temperature had been rising sharply for 15 years, and many predicted that this rate of warming would continue, when in fact it has halved. This lesson of history is regularly ignored as the current level of climate alarm is cranked up.”
This is apparently refuted by this graph-
84e54929f7cb75caecd6406eda85d995-huge-e-and-t-graph.png

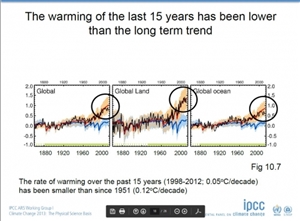
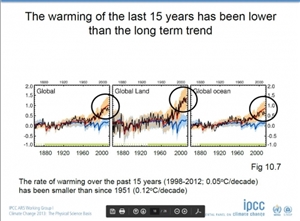
In reality the current state of the science is that the rate of increase has approximately halved. From the IPCC AR5 Working Group 1 ‘The Physical Science’ comes this graph and statement:
 
http://www.climatechange2013.org/images/uploads/hartmann13agu_U22A_final.pdf
 
1027c1ab184bafb5fcbeedb08da540a3-huge-ipcc-ar5-working-group-1.jpg


I consider 0.05°C per decade to be less than half of 0.12°C per decade.
 
The graph that in the article is not referenced but seems to be adapted from this set on the GISS website:
https://data.giss.nasa.gov/gistemp/graphs_v4/
It is interesting that is titled ‘Global Mean Estimates based on Land and Ocean Data’.
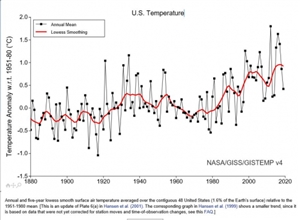
Also in the set is ‘U.S. Temperature’ which appears to be a measured rather than estimated dataset that also shows the reduced rate of warming in recent times.
10e8db9690d4a08318ceca0e7f78272c-huge-e-and-t-us-temperature.jpg

Is the statement by Mr (Professor) Kelly correct? Yes. This may change with the publication of the IPCC AR6 in 2021/22 but today the ‘pause’ is part of the science.


The article then goes on to challenge a GWPF Tweet:

‘don’t let the climate alarmists take our natural gas! All the major political parties at this election are planning to remove your gas boilers/cookers as part of their Net Zero plans ’.

A quick look at the mainstream media seems to support that the Net Zero plans do want to remove gas from domestic properties:

New rules for low carbon heating in Scots homes
https://www.bbc.com/news/uk-scotland-50993183
Central heating boilers 'put climate change goals at risk'
https://www.bbc.com/news/business-50041077
In Holland as well
https://www.hollandtimes.nl/articles/national/the-netherlands-to-go-completely-gas-free-in-the-future/

And from the UK Climate Change Commission:
0c45e568e84d45ae07ca271b14f424c2-huge-ccc-gas.jpg

https://www.theccc.org.uk/publication/uk-housing-fit-for-the-future/
This quote is from the executive summary 0n page 9 of the report.
Do the Net Zero plans aim to remove gas cookers and boilers? I think so.
 
There is then a block of financial conspiracy theories which I cannot comment on followed by Bob Ward of the Grantham Institute attacking the blogger Paul Homewood.

This is very much ‘sour grapes’ as Paul Homewood was involved in an investigation which resulted in a paper supported by Jeremy Grantham, who funds the Grantham Institute, being shown to be incorrect. In Mr Homewood’s own words:
https://notalotofpeopleknowthat.wordpress.com/2019/02/12/bbc-repeat-fake-disaster-claims/
https://notalotofpeopleknowthat.wordpress.com/2019/03/01/bbc-retract-fake-ippr-extreme-weather-claims/
And in italics at the end is the retraction from the BBC.
https://www.bbc.com/news/science-environment-47203344
 
Based on this sample I would expect to find other significant errors and falsehoods. May be someone else will check a few points? Is this the standard we expect from E&T?

Best Regards


Roger

Parents

  • Luciano Bacco:
    One for all: Are perhaps NASA people stupid ones?! Or are they REAL SCIENTISTS?! Or  even worse, are they  a " rabble of charlatans"  selling around the world their fake information?!
    https://climate.nasa.gov/


    NASA is a large organisation with many different branches. Some certainly do very good science, some are more politically orientated possibly with regards to government funding. The same applies to many large organisation.  I have previously post links to 3 pages on the Danish Met Office website regarding the Greenland ice sheet.

    The melting of the Greenland Ice Caps is an interesting question. If you look at the official Danish website different measures tell completely different stories:
    http://polarportal.dk/en/greenland/surface-conditions/
    This shows the surface mass balance which hasn’t really strayed much outside the 1981-2010 average. There’s no significant problem there.
    http://polarportal.dk/en/greenland/mass-and-height-change/
    This uses a different satellite based measurement which shows a steady decline in mass unlike the previous measurement.
    http://polarportal.dk/en/groenlands-indlandsis/nbsp/viden-om-groenlands-indlandsis/
    This is a complete disaster scenario quoting likely temperature rises by 2100 of 5-10°C and giving a sea level rise of 7m if all the ice melted. The actual sea level rise quoted is currently around 0.6mm per year, 60mm per century.


    So which of those is the truth? The answer may be none of then. The first two are different ways of measuring but do either tell us there is a problem? How do we measure loss of ice? Mass or area? The third one is worst case extrapolation based on mathematical models.


    I followed the NASA link through to resources and chose a simple one:

    http://climate.nasa.gov/climate_resources/26/graphic-the-ipccs-four-key-findings/


    This  is referenced to the IPCC AR5 Working Group 1 summary for policy makers:

    http://www.climatechange2013.org/images/report/WG1AR5_SPM_FINAL.pdf


    What is interesting here is that I have previously quoted Working Group 1's reference to the 'Pause'.

    1027c1ab184bafb5fcbeedb08da540a3-huge-ipcc-ar5-working-group-1.jpg

    http://www.climatechange2013.org/images/uploads/hartmann13agu_U22A_final.pdf


    The 'Pause' does not exist in the summary for policy makers so what happened? I could say that the scientists did their work correctly but the 'political' branch did not like it and suppressed it. From your statement I think that the scientists are real scientists but the people translating the information for general consumption may be the " rabble of charlatans".


    Best regards


    Roger


Reply

  • Luciano Bacco:
    One for all: Are perhaps NASA people stupid ones?! Or are they REAL SCIENTISTS?! Or  even worse, are they  a " rabble of charlatans"  selling around the world their fake information?!
    https://climate.nasa.gov/


    NASA is a large organisation with many different branches. Some certainly do very good science, some are more politically orientated possibly with regards to government funding. The same applies to many large organisation.  I have previously post links to 3 pages on the Danish Met Office website regarding the Greenland ice sheet.

    The melting of the Greenland Ice Caps is an interesting question. If you look at the official Danish website different measures tell completely different stories:
    http://polarportal.dk/en/greenland/surface-conditions/
    This shows the surface mass balance which hasn’t really strayed much outside the 1981-2010 average. There’s no significant problem there.
    http://polarportal.dk/en/greenland/mass-and-height-change/
    This uses a different satellite based measurement which shows a steady decline in mass unlike the previous measurement.
    http://polarportal.dk/en/groenlands-indlandsis/nbsp/viden-om-groenlands-indlandsis/
    This is a complete disaster scenario quoting likely temperature rises by 2100 of 5-10°C and giving a sea level rise of 7m if all the ice melted. The actual sea level rise quoted is currently around 0.6mm per year, 60mm per century.


    So which of those is the truth? The answer may be none of then. The first two are different ways of measuring but do either tell us there is a problem? How do we measure loss of ice? Mass or area? The third one is worst case extrapolation based on mathematical models.


    I followed the NASA link through to resources and chose a simple one:

    http://climate.nasa.gov/climate_resources/26/graphic-the-ipccs-four-key-findings/


    This  is referenced to the IPCC AR5 Working Group 1 summary for policy makers:

    http://www.climatechange2013.org/images/report/WG1AR5_SPM_FINAL.pdf


    What is interesting here is that I have previously quoted Working Group 1's reference to the 'Pause'.

    1027c1ab184bafb5fcbeedb08da540a3-huge-ipcc-ar5-working-group-1.jpg

    http://www.climatechange2013.org/images/uploads/hartmann13agu_U22A_final.pdf


    The 'Pause' does not exist in the summary for policy makers so what happened? I could say that the scientists did their work correctly but the 'political' branch did not like it and suppressed it. From your statement I think that the scientists are real scientists but the people translating the information for general consumption may be the " rabble of charlatans".


    Best regards


    Roger


Children
No Data