This discussion is locked.
You cannot post a reply to this discussion. If you have a question start a new discussion

Challenge and investigate or accept the narrative; Are we loosing context and perspective?

How often do you read something and wonder whether you are being led down a particular path, or whether you are getting all the relevant information, and what do you do?
I read an article in the November issue of the E&T Magazine which prompted me to contact one of the magazine’s editors with regard to the reporting. I should say that many of the November issue articles gave me cause for concern on the messaging. I’ve included my correspondence and the response from the E&T editor.
What’s your view of selective data being presented because “its relevant to the issue it illustrates”? (ie the data fits the narrative).
What should we expect from the E&T publication (acknowledging that the IET is not responsible for the opinions expressed in the E&T publication)?
If you are interested, The Royal Society published the following paper on the subject of wildfires:
Global trends in wildfire and its impacts: perceptions versus realities in a changing world
dx.doi.org/.../rstb.2015.0345

Letter to the Editor on E&T Magazine Article
“I have been a member of the IEEE and IET for over 40 years and a reader of the magazine over that period.
I am writing to you as managing editor of the magazine, as I am becoming increasingly concerned by the lack of balance and omission of context in the reporting I have seen over time, from what is purported to be an engineering magazine, (not a political news sheet). This directly impacts the integrity of reporting and the credibility of the publication.
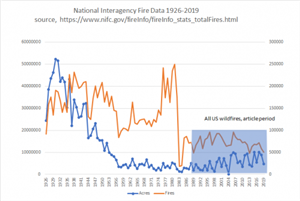
As example, I draw your attention to the Nov 2020 issue The Graphic; Forest Fire Fighting; and the graphic showing US fires growth.
I was interested in why the1988 start date was chosen, so went to the referenced website to check the source data. The full set of wildfire data from 1926 is shown in the graphic below, with the excerpt of the data used in the article (highlighted). While there is a caveat on the website for pre 1983 data, the information is readily available on the site and as such must have value, although it was not collected using the current reporting process.
This full information is important to understand context, and put the current rising US wildfire trend in perspective. There are many factors which contribute to and acerbate the size and extent of forest fires. Climate is a factor, as is land management through prescribed burns, ability to maintain fire breaks, access and managing forest floor clearing, many of which have been adversely impacted by the enacting of environmental legislation.
As an engineering magazine I'd expect the IET's E&T’s reporting and articles to fully represent the issue context and disclose all the relevant data. I hope you agree that this is important from an integrity perspective and to preserve and make informed, unbiased and balanced commentary.”
61f95277d7c2a99a351af441e5bb05f7-huge-image-20201118084018-1.png
Response from Editor (names and email xxxxx’d out)
“xxxxxxxxxxxxx and I have discussed your points with E&T associate editor xxxxxxxxxx, who put together this article.
xxxxxx has pointed out that the timeframe shown was selected by the National Forestry Center in providing the data to media, because it believes it to be the most reliable and relevant to the issue it illustrates. The same information was used by other publications, such as The Economist, in articles on the subject.
www.economist.com/.../the-area-burned-by-wildfire-in-america-has-quadrupled-in-40-years
https://www.economist.com/leaders/2020/09/12/why-is-california-burning
I hope this helps to explain the thinking behind this article. If you do have any other thoughts or would like further clarification you can contact xxxxx directly at xxxxxxxxxxxxxxx”


Parents
  • Roger, thanks for your input to the thread. I agree with you that the polarisation of the discussion is extreme and that decisions are being made based more on virtue signaling than appropriate analysis of cost/benefits. The costs involved for “Net Zero ”are huge, and undoubtedly underestimated. The UK tax payer will pay for the subsidies for intermittent renewable power, development of hydrogen and all the other rent seeking schemes, and for any poor policy decisions by way of higher taxes and reduced living standards.

    Energy poverty is already a problem as evidenced from the State of the Energy Market 2019 Report issued from Offgen. Note particularly the excess deaths from cold of 16500. This is a tragedy that could be easily remedied at vastly lower costs than the COVID effort, yet almost goes unnoticed and unreported.
    https://www.ofgem.gov.uk/publications-and-updates/state-energy-market-2019
    Key facts on Affordability and Vulnerability

    £1,184  Average dual-fuel energy bill for a typical consumer with the large suppliers in 2018 (last year: £1,117), an increase in real terms of 4% in 2018 prices.
    8% The proportion of total expenditure that low income households spent on energy in 2017-18, compared to 4% for the average income household.
    19% The proportion of households in England living in privately rented homes that are identified as being fuel poor, compared with 11% of all English households.[1]
    26% The proportion of households in Scotland living in privately rented homes that are identified as being fuel poor, compared with 25% of all Scottish households.
    20% The proportion of households in Wales living in privately rented homes that are identified as being fuel poor, compared with 12% of all Welsh households.
    14% The proportion of prepayment meter customers who reported having self-disconnected in 2018 (last year: 10%)
    16,500 The number of excess winter deaths that can be linked to people living in cold homes in winter 2017-18.

    I also read the article you refer to in the E&T “The Limit in the Sky” where it states “clouds matter because more than 40 years later there is still scientific debate over the extent to which they sometimes warm and sometimes cool the planet”.  As water vapour has by far the largest greenhouse gas impact, surely this is a fundamental parameter that needs to be fully understood in any model.  Is this an acknowledgement that the political statement ‘the science is settled’ was premature and erroneous, or an appeal to fund more expensive and powerful computing techniques and resources which will be capable of calculating to greater accuracy, from models that must be “tuned” to achieve an acceptable output.

    I fully support your approach to encourage people to step back from the rhetoric, look at the facts and numerical analysis and form their own views. 

Reply
  • Roger, thanks for your input to the thread. I agree with you that the polarisation of the discussion is extreme and that decisions are being made based more on virtue signaling than appropriate analysis of cost/benefits. The costs involved for “Net Zero ”are huge, and undoubtedly underestimated. The UK tax payer will pay for the subsidies for intermittent renewable power, development of hydrogen and all the other rent seeking schemes, and for any poor policy decisions by way of higher taxes and reduced living standards.

    Energy poverty is already a problem as evidenced from the State of the Energy Market 2019 Report issued from Offgen. Note particularly the excess deaths from cold of 16500. This is a tragedy that could be easily remedied at vastly lower costs than the COVID effort, yet almost goes unnoticed and unreported.
    https://www.ofgem.gov.uk/publications-and-updates/state-energy-market-2019
    Key facts on Affordability and Vulnerability

    £1,184  Average dual-fuel energy bill for a typical consumer with the large suppliers in 2018 (last year: £1,117), an increase in real terms of 4% in 2018 prices.
    8% The proportion of total expenditure that low income households spent on energy in 2017-18, compared to 4% for the average income household.
    19% The proportion of households in England living in privately rented homes that are identified as being fuel poor, compared with 11% of all English households.[1]
    26% The proportion of households in Scotland living in privately rented homes that are identified as being fuel poor, compared with 25% of all Scottish households.
    20% The proportion of households in Wales living in privately rented homes that are identified as being fuel poor, compared with 12% of all Welsh households.
    14% The proportion of prepayment meter customers who reported having self-disconnected in 2018 (last year: 10%)
    16,500 The number of excess winter deaths that can be linked to people living in cold homes in winter 2017-18.

    I also read the article you refer to in the E&T “The Limit in the Sky” where it states “clouds matter because more than 40 years later there is still scientific debate over the extent to which they sometimes warm and sometimes cool the planet”.  As water vapour has by far the largest greenhouse gas impact, surely this is a fundamental parameter that needs to be fully understood in any model.  Is this an acknowledgement that the political statement ‘the science is settled’ was premature and erroneous, or an appeal to fund more expensive and powerful computing techniques and resources which will be capable of calculating to greater accuracy, from models that must be “tuned” to achieve an acceptable output.

    I fully support your approach to encourage people to step back from the rhetoric, look at the facts and numerical analysis and form their own views. 

Children
No Data