You can no longer post new replies to this discussion. If you have a question you can start a new discussion
What is net zero and why is it necessary?
Former Community Member
Decarbonising quickly and effectively to hit our net-zero target by 2050 requires urgent, clear and decisive leadership. Our short video looks at the skills requirements for delivering this target and breaks down the results from our recent Skills for net zero and a green recovery survey. Watch the video and sign in to let us know your thoughts in the comments!
A lot of questions and points that are difficult to answer. Sometimes the information is in what is not published.
I am in complete agreement about the excessive use of finite resources. The ‘Greens’ demands for ‘Net Zero’ by 2030-35 are ridiculous. Do they think that wind turbines are made from unicorn poo? A lot of fossil fuel with a long energy payback time will be burnt to meet St Greta’s demands. A lot of pollution will be generated by the mining and refining of these materials. The ‘Climate Emergency’ data seems rather dubious as I will show from a couple of ‘official’ sources. It appears we may have a climate problem rather than an ‘Emergency’ so solutions can be implemented rather more sensibly.
As most solar panels are made in China using coal as the prime energy source I doubt if the figures have changed much.
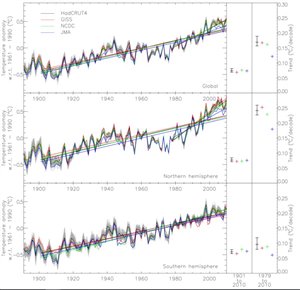
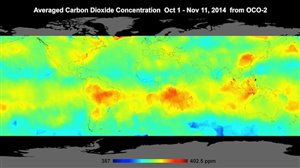
The UK Met office published a nice set of graphs, HadCRUT, showing global temperature increases. They stopped updating this in 2010 when the flattening was becoming obvious. Interestingly the Japanese numbers were significantly below the others at this point. The graphs also show the deviation increasing between the northern and southern hemispheres. Why should this be? If CO2 was responsible it should be reversed as the concentrations from the OCO2 satellite show higher concentrations in the southern hemisphere (this satellite was launched to ‘prove’ that the main source of CO2 was the industrial areas. After this appeared not to be the case all went quiet.)
The only current graphs I can find are from NASA GISS.
Between 2010 and 2020 the global temperatures and the northern hemisphere temperatures climb rapidly. The southern hemisphere continues on a fairly steady climb. What is also interesting is that the ‘Monthly Mean Global Surface Temperature’ graph shows a steady decrease in the last year. Both sets of graphs appear to be based on land and ocean data and use the same baseline. Is one real and one for publicity? Looking at this there may be a climate problem, but certainly not an emergency.
The melting of the Greenland Ice Caps is another interesting question. If you look at the official Danish website different measures tell completely different stories:
This uses a different satellite based measurement which shows a steady decline in mass unlike the previous measurement. This melting contributes around 0.6mm to sea level rise.
This is the big numbers complete disaster scenario page quoting likely temperature rises by 2100 of 5-10°C and giving a sea level rise of 7m if all the ice melted. The actual sea level rise quoted is currently around 0.6mm per year, 60mm per century as above.
So what is true/real? Is the reason there is no real engineering debate that the hype, exaggeration and some made up numbers will be discovered.
A lot of questions and points that are difficult to answer. Sometimes the information is in what is not published.
I am in complete agreement about the excessive use of finite resources. The ‘Greens’ demands for ‘Net Zero’ by 2030-35 are ridiculous. Do they think that wind turbines are made from unicorn poo? A lot of fossil fuel with a long energy payback time will be burnt to meet St Greta’s demands. A lot of pollution will be generated by the mining and refining of these materials. The ‘Climate Emergency’ data seems rather dubious as I will show from a couple of ‘official’ sources. It appears we may have a climate problem rather than an ‘Emergency’ so solutions can be implemented rather more sensibly.
As most solar panels are made in China using coal as the prime energy source I doubt if the figures have changed much.
The UK Met office published a nice set of graphs, HadCRUT, showing global temperature increases. They stopped updating this in 2010 when the flattening was becoming obvious. Interestingly the Japanese numbers were significantly below the others at this point. The graphs also show the deviation increasing between the northern and southern hemispheres. Why should this be? If CO2 was responsible it should be reversed as the concentrations from the OCO2 satellite show higher concentrations in the southern hemisphere (this satellite was launched to ‘prove’ that the main source of CO2 was the industrial areas. After this appeared not to be the case all went quiet.)
The only current graphs I can find are from NASA GISS.
Between 2010 and 2020 the global temperatures and the northern hemisphere temperatures climb rapidly. The southern hemisphere continues on a fairly steady climb. What is also interesting is that the ‘Monthly Mean Global Surface Temperature’ graph shows a steady decrease in the last year. Both sets of graphs appear to be based on land and ocean data and use the same baseline. Is one real and one for publicity? Looking at this there may be a climate problem, but certainly not an emergency.
The melting of the Greenland Ice Caps is another interesting question. If you look at the official Danish website different measures tell completely different stories:
This uses a different satellite based measurement which shows a steady decline in mass unlike the previous measurement. This melting contributes around 0.6mm to sea level rise.
This is the big numbers complete disaster scenario page quoting likely temperature rises by 2100 of 5-10°C and giving a sea level rise of 7m if all the ice melted. The actual sea level rise quoted is currently around 0.6mm per year, 60mm per century as above.
So what is true/real? Is the reason there is no real engineering debate that the hype, exaggeration and some made up numbers will be discovered.