This discussion is locked.
You cannot post a reply to this discussion. If you have a question start a new discussion

Can clouds improve PV output?

I've been playing with a slightly home-brew version of an open energy monitor, and been looking a some graphs of my minute-by-minute PV output and noticed something odd.


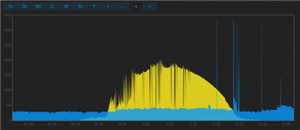
On a nice clear sunny day I get a nice bell-shaped curve for PV output peaking at solar midday (my panels face almost exactly due south) with a peak output a little below their peak rating. All as expected. When it's cloudy, output is of course much reduced, again as expected. What I've noticed is that when the sun returns after a cloud passes it seems that the PV output is for a short while higher than what would have been expected had there been continuous sunshine - not for long - a matter of minutes - before it returns to normal.


My guess is that this is due to the panels getting hot in the sun - which  drops their efficiency. When a cloud passes they get a chance to cool down for a but - so their efficiency goes up for a while until they've heated up again. Does that make sense?


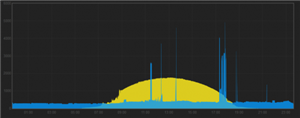
A couple of graphs (from a few days apart this month) (PV is yellow, ignore the blue, that's just my consumption).


Firstly from a pretty clear sunny day (just a few clouds first thing in the morning) - peak is well below the 2000W line.
f620f26d5e1fd3d8ff017864ce84e3f3-huge-pvsunny.png


and then from a day with a few more broken clouds (unfortunately at a different scale - but after each cloud the output seems to be higher than the normal trend - at mid-day the spikes are much closer to the 2000W line than on a clear day) -
693782b11c6d89b9c59940095bf3bfdd-huge-pvsunnyish.png
Parents
  • I'm not too sure what this is showing - there are 2 colours of blue blocks and a yellow arc - is one of these power output, and why is it solid, and not a line, does this represent the short duration blackouts.

    Apologies - not my graphs - just what the OEM app produces by default.


    There are two lines on the same axes - PV generation and total consumption - both "filled" - so blue for consumption, yellow for PV and so producing cyan/light-blue where they overlap.


    So the total height of the yellow (or light blue/cyan) is the PV generation. The total height of the blue is my consumption - this the true blue area is "import" and the lighter blue/cyan area "internal consumption", so the pure yellow area "export".


    I'll see if I can produce some clearer ones...


       - Andy.
Reply
  • I'm not too sure what this is showing - there are 2 colours of blue blocks and a yellow arc - is one of these power output, and why is it solid, and not a line, does this represent the short duration blackouts.

    Apologies - not my graphs - just what the OEM app produces by default.


    There are two lines on the same axes - PV generation and total consumption - both "filled" - so blue for consumption, yellow for PV and so producing cyan/light-blue where they overlap.


    So the total height of the yellow (or light blue/cyan) is the PV generation. The total height of the blue is my consumption - this the true blue area is "import" and the lighter blue/cyan area "internal consumption", so the pure yellow area "export".


    I'll see if I can produce some clearer ones...


       - Andy.
Children
No Data