This discussion has been locked.
You can no longer post new replies to this discussion. If you have a question you can start a new discussion

I hope the Climate Activists are proud of the effect their lies are having on the younger generation

If this survey is real the messages these young people are receiving are completely wrong.

We need to reduce our impact on our planet but CO2 is a complete red herring. The current ECS (temperature increase for a doubling of CO2 in the atmosphere) is centred around 3°C (IPCC AR6). The 2°C will destroy civilisation is simply made up.


Parents
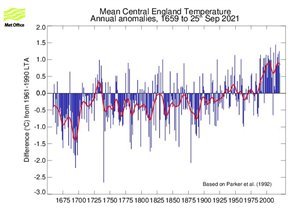
  • I see that the CET series is being mentioned.  

    69a62e18d0d4c0f6895c643fe326905a-original-cet-sept-21.jpg

    https://www.metoffice.gov.uk/hadobs/hadcet/

    It shows some quite interesting things. 

    Between 1700 and 1730 there is a rise of at least 1.5°C, was that due to manmade emissions?

    From around 1950 to 1970 the temperature falls around 0.5°C. This produced the global cooling ‘crisis’. The CIA was sufficiently concerned to generate a report on the likely risks to global stability.

    http://www.climatemonitor.it/wp-content/uploads/2009/12/1974.pdf

    From around 1975-80 to 2000 there is a rise of around 1°C which launched the global warming crisis. After that the temperatures have remained fairly stable.

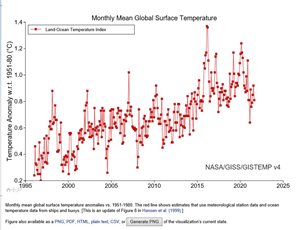
    For more global look at the recent temperatures the GISSTEMP v4 shows a slow rise from 1995 up to 2015 followed by a slow drop.

    ba303318f4fe6e009f79a38568ec69d1-original-gisstemp-v4-sept-21.jpg

    https://data.giss.nasa.gov/gistemp/graphs_v4/

    None of this looks like the infamous ‘Hockey stick’ of Dr Michael Mann or the temperature graph given in IPCC AR6.

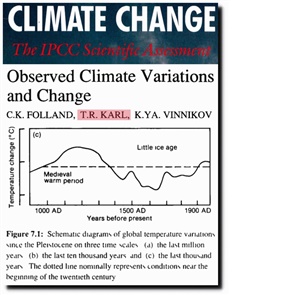
    It is interesting that the 1st IPCC report was quite happy with the Medieval Warm Period and Little Ice Age. They were later ‘homogenised’ out of existence because they didn’t agree with the models.

    c890490410c1ae2b3e6f580b64fc77ca-original-ipcc-mwp.jpg


    https://www.ipcc.ch/site/assets/uploads/2018/03/ipcc_far_wg_I_chapter_07-1.pdf


    Now we just have scare mongering based on unvalidated computer models and extreme scenarios like RPC8.5.

Reply
  • I see that the CET series is being mentioned.  

    69a62e18d0d4c0f6895c643fe326905a-original-cet-sept-21.jpg

    https://www.metoffice.gov.uk/hadobs/hadcet/

    It shows some quite interesting things. 

    Between 1700 and 1730 there is a rise of at least 1.5°C, was that due to manmade emissions?

    From around 1950 to 1970 the temperature falls around 0.5°C. This produced the global cooling ‘crisis’. The CIA was sufficiently concerned to generate a report on the likely risks to global stability.

    http://www.climatemonitor.it/wp-content/uploads/2009/12/1974.pdf

    From around 1975-80 to 2000 there is a rise of around 1°C which launched the global warming crisis. After that the temperatures have remained fairly stable.

    For more global look at the recent temperatures the GISSTEMP v4 shows a slow rise from 1995 up to 2015 followed by a slow drop.

    ba303318f4fe6e009f79a38568ec69d1-original-gisstemp-v4-sept-21.jpg

    https://data.giss.nasa.gov/gistemp/graphs_v4/

    None of this looks like the infamous ‘Hockey stick’ of Dr Michael Mann or the temperature graph given in IPCC AR6.

    It is interesting that the 1st IPCC report was quite happy with the Medieval Warm Period and Little Ice Age. They were later ‘homogenised’ out of existence because they didn’t agree with the models.

    c890490410c1ae2b3e6f580b64fc77ca-original-ipcc-mwp.jpg


    https://www.ipcc.ch/site/assets/uploads/2018/03/ipcc_far_wg_I_chapter_07-1.pdf


    Now we just have scare mongering based on unvalidated computer models and extreme scenarios like RPC8.5.

Children
No Data