This discussion has been locked.
You can no longer post new replies to this discussion. If you have a question you can start a new discussion

I hope the Climate Activists are proud of the effect their lies are having on the younger generation

If this survey is real the messages these young people are receiving are completely wrong.

We need to reduce our impact on our planet but CO2 is a complete red herring. The current ECS (temperature increase for a doubling of CO2 in the atmosphere) is centred around 3°C (IPCC AR6). The 2°C will destroy civilisation is simply made up.


Parents
  • Peter,

    The message you are trying to get across seems rather confused. As I understand we are talking about AGW, Anthropogenic GLOBAL Warming. This has many events attributed to it all around the globe, melting ice at both poles, destruction of the great barrier reef, wild fires in the USA and Australia, floods everywhere.

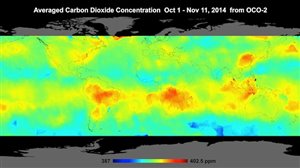
    If, as we are told, CO2 is the driver it will take place all over the world. The OCO-2 satellite was launched in 2014 to measure global CO2 levels. The early measurements showed higher concentrations in the southern hemisphere, not what climate science wanted to see, so it is currently somewhat in the background. If, as you propose, AGW is a northern hemisphere phenomena why are the levels higher in the south than the north?


    0088126cd05ea0085adee68d89993846-original-oco2-map.jpg


    https://ocov2.jpl.nasa.gov/

    As I have said before interesting though the CET series is it is definitely not global.  The temperature rise between 1950 and 2000 in the northern hemisphere is not global. If CO2 is the driver why are we not seeing the same phenomena globally?

    Do you accept that the Medieval Warm Period and the Little Ice Age existed and were of sufficient magnitude to be recorded? I agree the magnitude is difficult to determine accurately, but to cause a noticeable effect it is very likely to have been more than 1°C. it is also difficult to determine if they were global or not as there were very few records of southern hemisphere climate during that period. If CO2/Greenhouse Gasses were the cause, where did they come from? If they were not the cause and the MWP and LIA were caused by natural variations/cycles then these must be at least as large as is proposed for the current AGW effect. This does not agree with current AGW dogma so they were just wiped from the record as just local phenomena.

    If the AGW dogma ignores one local phenomena because it doesn’t agree with their models  but accepts another because it does it is just that, dogma, not science.


    You are surely not seriously trying to suggest that a scale of a graph has been chosen in AR6 to mislead people? I would think most of the people bothering to try to read AR6 have known how to read 2D Cartesian graphs since their teens.

    If you go back to the reason I started this thread the AGW dogma requires ‘scary’ graphs to display in newspapers and on Extinction Rebellion and Fridays for Future websites. That is exactly why the adjust the scaling to justify ‘we are all going to burn’. These graphs are not targeted at people who understand science, they are there to be copied and justified with an IPCC title.

Reply
  • Peter,

    The message you are trying to get across seems rather confused. As I understand we are talking about AGW, Anthropogenic GLOBAL Warming. This has many events attributed to it all around the globe, melting ice at both poles, destruction of the great barrier reef, wild fires in the USA and Australia, floods everywhere.

    If, as we are told, CO2 is the driver it will take place all over the world. The OCO-2 satellite was launched in 2014 to measure global CO2 levels. The early measurements showed higher concentrations in the southern hemisphere, not what climate science wanted to see, so it is currently somewhat in the background. If, as you propose, AGW is a northern hemisphere phenomena why are the levels higher in the south than the north?


    0088126cd05ea0085adee68d89993846-original-oco2-map.jpg


    https://ocov2.jpl.nasa.gov/

    As I have said before interesting though the CET series is it is definitely not global.  The temperature rise between 1950 and 2000 in the northern hemisphere is not global. If CO2 is the driver why are we not seeing the same phenomena globally?

    Do you accept that the Medieval Warm Period and the Little Ice Age existed and were of sufficient magnitude to be recorded? I agree the magnitude is difficult to determine accurately, but to cause a noticeable effect it is very likely to have been more than 1°C. it is also difficult to determine if they were global or not as there were very few records of southern hemisphere climate during that period. If CO2/Greenhouse Gasses were the cause, where did they come from? If they were not the cause and the MWP and LIA were caused by natural variations/cycles then these must be at least as large as is proposed for the current AGW effect. This does not agree with current AGW dogma so they were just wiped from the record as just local phenomena.

    If the AGW dogma ignores one local phenomena because it doesn’t agree with their models  but accepts another because it does it is just that, dogma, not science.


    You are surely not seriously trying to suggest that a scale of a graph has been chosen in AR6 to mislead people? I would think most of the people bothering to try to read AR6 have known how to read 2D Cartesian graphs since their teens.

    If you go back to the reason I started this thread the AGW dogma requires ‘scary’ graphs to display in newspapers and on Extinction Rebellion and Fridays for Future websites. That is exactly why the adjust the scaling to justify ‘we are all going to burn’. These graphs are not targeted at people who understand science, they are there to be copied and justified with an IPCC title.

Children
No Data