This discussion is locked.
You cannot post a reply to this discussion. If you have a question start a new discussion

Generation

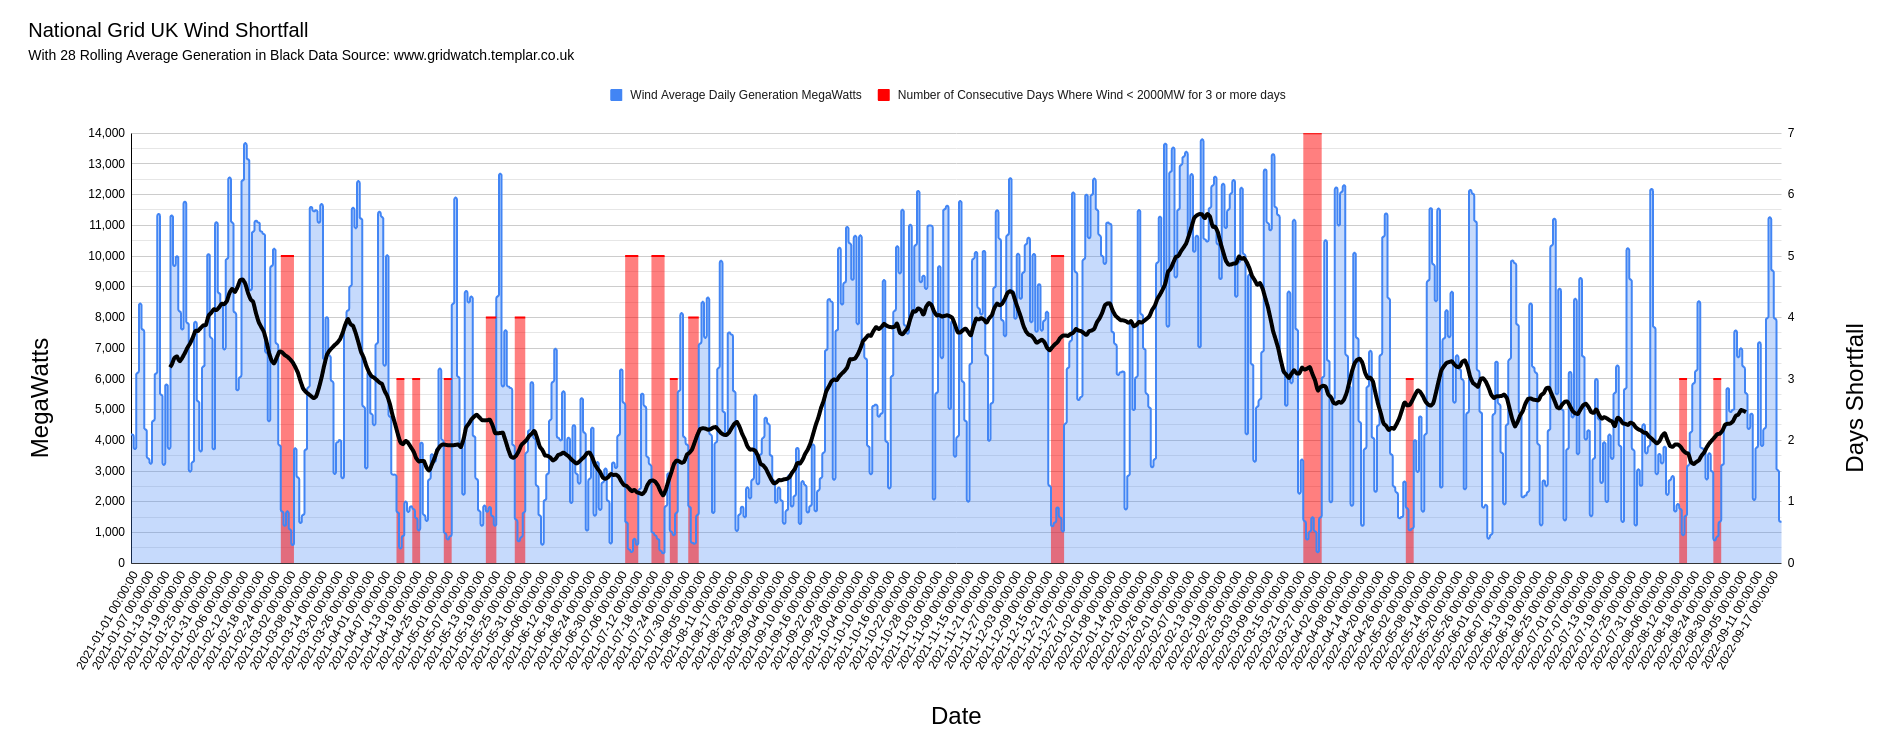
I'd noticed recently on www.gridwatch.templar.co.uk/ that gas-fired generation had been surprisingly flat - normally it seems to be the first choice for responding to changes in demand after the renewables have done what they can - usually increasing in a morning as demand increases, then dipping as solar generates more during the middle of the day and then increasing again for the late afternoon/evening peak. Recently though it seems to almost flat-lining at around 15GW all day every day (other than early Sunday morning).

My guess was that we were running gas flat out and exporting the extra to the continent to make up for their shortfall due lack of generation from Russian gas ... but it sounds like they're having a lot more problems than I anticipated: https://www.bbc.co.uk/news/science-environment-62524551 (not just drought as the story title implies, but serious corrosion problems with many Nuclear plants too).

   - Andy.

Parents
  • I just pulled the gridwatch data down, aggregated it to hourly, daily and monthly max/avg readings and looked at wind and solar. This is unchecked data apart from removing a few obvious outliers on some readings.

    Wind has had quite a few periods since Jan 2021 where average daily output fell below 2000MW for 3 or more days.
    The worst was March this year, 21-28 where the shortfall** (average annual output of 5,588MW minus spot average) summed up to around 757,783MWh

    To store that shortfall from good days prior would need 83 Dinorwigs or 56 million Tesla Powerwall 2 battery units.

    ** Crude shortfall calculation. I'm aware National Grid may not need that shortfall to keep the lights on, because it will be highly dependent on demand and other sources and timing. But I don't have a better metric.

    Solar's not very promising either: This is gridwatch reported solar generation. So no idea if this is limited to commercial solar farms or includes domestic or other Feed In.

    But either way the peak monthly-average-output is 2500MW which is not that inspiring and winter output is around 15% of that.


    3 nuclear plants closed in the last 2 years totalling 3GW. I'd say this winter is going to get dicey. 

Reply
  • I just pulled the gridwatch data down, aggregated it to hourly, daily and monthly max/avg readings and looked at wind and solar. This is unchecked data apart from removing a few obvious outliers on some readings.

    Wind has had quite a few periods since Jan 2021 where average daily output fell below 2000MW for 3 or more days.
    The worst was March this year, 21-28 where the shortfall** (average annual output of 5,588MW minus spot average) summed up to around 757,783MWh

    To store that shortfall from good days prior would need 83 Dinorwigs or 56 million Tesla Powerwall 2 battery units.

    ** Crude shortfall calculation. I'm aware National Grid may not need that shortfall to keep the lights on, because it will be highly dependent on demand and other sources and timing. But I don't have a better metric.

    Solar's not very promising either: This is gridwatch reported solar generation. So no idea if this is limited to commercial solar farms or includes domestic or other Feed In.

    But either way the peak monthly-average-output is 2500MW which is not that inspiring and winter output is around 15% of that.


    3 nuclear plants closed in the last 2 years totalling 3GW. I'd say this winter is going to get dicey. 

Children
No Data