The Definition of Global Average Temperature.

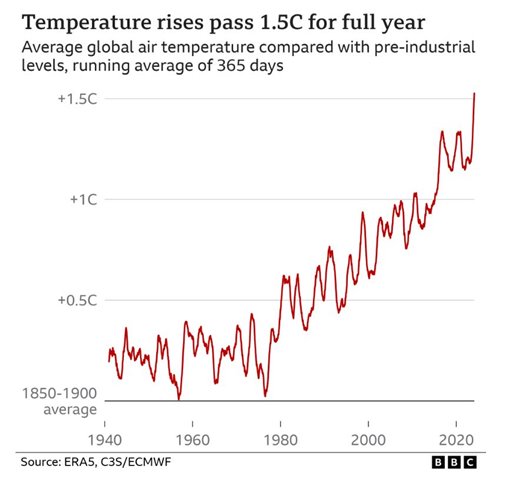
2023 confirmed as world's hottest year on record:

https://www.bbc.com/news/science-environment-67861954

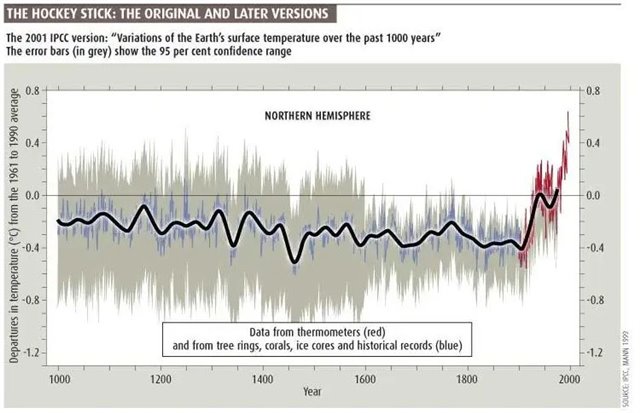
‘The Hottest Year on Record’, how was this determined, how can it be validated? Many media sources seem to think that this magical figure, Annual Average Global Temperature, exists. Another example from the BBC:

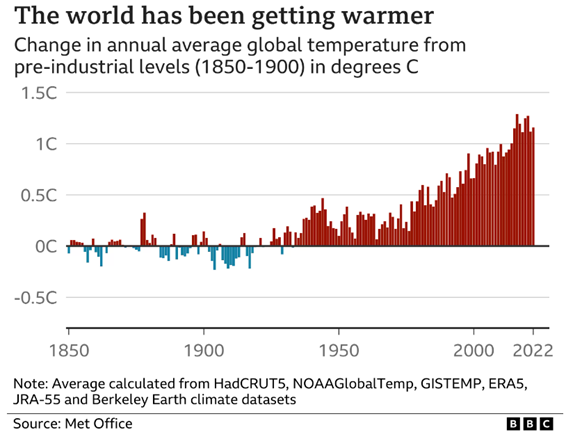
https://www.bbc.com/news/science-environment-24021772

The figures here are calculated from the average of 6 data sets from different sources, most of which have only come into existence recently. Where do the older figures come from? How is it determined that the measurements are consistent?

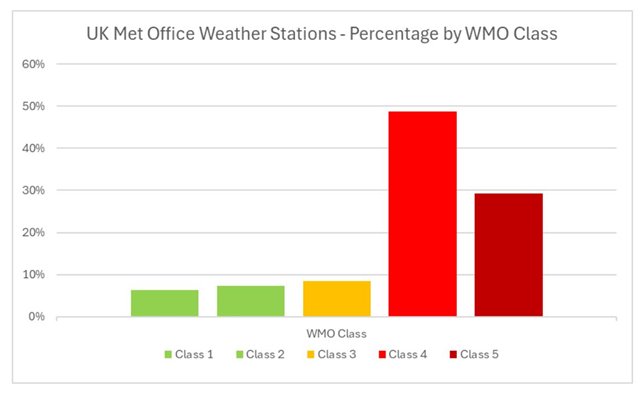
The various Met offices around the world have been collecting measurements for many years, however the measurement techniques and the locations of the measuring stations have changed over time. Historically the measurements were taken manually at various intervals ranging from daily to every half hour. Today they are recorded automatically so peaks that may have been missed by manual recording will appear in the trends. Locations also change over time. There are strict requirements for ‘Class 1’ weather stations, specifying distances from any features likely to compromise the readings. Many measuring stations  are located at aerodromes/airports which have been significantly developed, for example grass runways replaced with tarmac which will increase the local temperature.

How the averages are weighted is also important. Looking at temperature change graphs from different latitudes shows the problem. The BBC graphic above is very close to the northern latitudes  curve but the temperature change in the southern latitudes is about half that of the north and is similar to the tropics. An average of all three curves would show a significantly smaller change than the BBC one. Which it true?


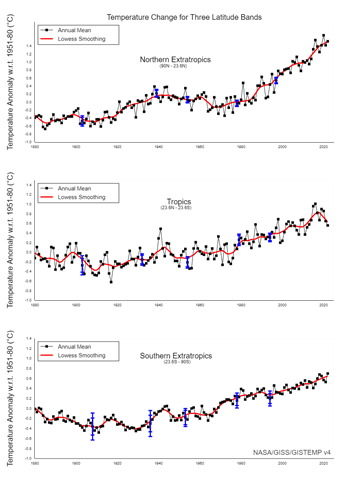
https://data.giss.nasa.gov/gistemp/graphs_v4/


Even the Climate Activist Grantham Institute accepts that there is a problem:

‘Statements such as “2014 earth’s warmest year on record” or “No global warming for 18 years 1 month” are conclusions from different atmospheric temperature data sets.  Before assessing which is true it is important to understand how temperatures are measured, how data sets are created and used to calculate global temperatures, and the strengths and weaknesses of each approach.’

https://granthaminstitute.com/2015/10/16/taking-the-planets-temperature-how-are-global-temperatures-calculated/

If the Annual Average Global Temperature is not consistent any calculations showing the effect of rising CO2 levels must also be inconsistent. Are the CO2 levels in the southern hemisphere less than in the north?

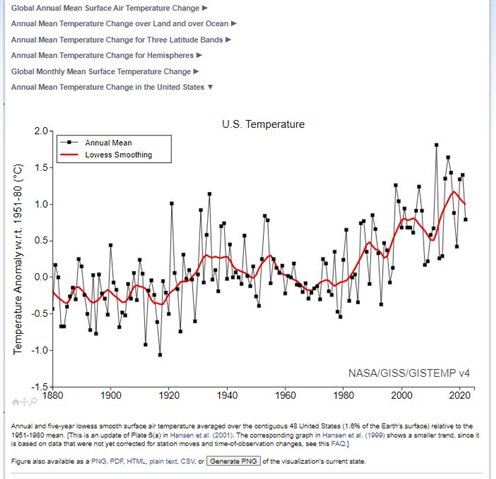
Why don’t we see this temperature rise in the US data, also from NASA GISS?


Can anyone point me to a definitive source for the ‘Global Average Temperature’ that is currently driving the ‘Climate Emergency’?

The rate of rise of temperature is critical for the setting of policies. Do we have a climate emergency or just a climate problem?

If the rate of rise is over estimated huge amounts of the earths finite resources will be wasted producing low energy density intermittent power sources and scrapping existing, not life expired power sources.

If the rate of rise is more reasonable we have time to run the existing fossil fuel powered systems to the end of their lives, replace them with modern nuclear power plants and upgrade the energy distribution system. There is also time to upgrade/replace the housing stock to reduce energy losses there.

What would be a sensible approach if the rate of temperature rise is half of the figure the headlines are giving us? How can we get a reliable figure?

An interesting piece on climate scare mongering from Hannah Ritchie:

https://www.theguardian.com/environment/2024/jan/02/hannah-ritchie-not-the-end-of-the-world-interview

  • How do you define "definitive source"?

  • I take it very simply as a source that is defined. What I would like to find is something like:

    ------------------------------------------------------------------------------------------------------------------

    Between 1850 and 1900 the global average temperature is the average of the readings from the following list of weather stations:……..

    Between 1900 and 1950 the global average temperature is the average reading of the weather stations closest to the intersections of a 100km square grid. Where there is no station nearby the point is ignored. Sea temperature readings are corrected by a factor of XXX compared to the land measurements which are taken at 1.5m above the surface.

    After 1950 the global average temperature is a mixture of class 1 measuring stations on land based on a 50km square grid, Argos buoy sea temperatures and satellite measurements. The following adjustments are applied to the sea and satellite readings………

    -----------------------------------------------------------------------------------------------------------------

    Unfortunately nothing like this seems to exist.

    If you read the Grantham Institute paper there are a lot of compensation/adjustments made with no real justification other than getting the answer they want.  The paper also notes that no temperature rise for the last 18 years is also a valid answer from the satellite temperature measurements.


    I find this a significant problem as this number ‘Global Average Temperature’ is used to calibrate a computer model that is then used as justification for the spending of Trillions of dollars/pounds/euros/francs etc. as well as demanding major lifestyle changes. As I have said many times before I believe that the climate is changing and that we need to reduce our impact on the planet and the consumption of its finite resources. We must however do it transparently, not just trying to demand change without justification.

  • Doesn't exist.  Our forefathers measured temperature with glass and Mercury or below -40 used Alcohol which gave a max min daily measurement then a manual reset. Today's measurements are from thermistors which have no inertia. Add to that urban heat island effect and an urban population expansion and you get an unrealistic temperature measurement. This is not considered no2 the alarmists are in charge and these facts are avoided at all costs to push the warmists agenda.

  • Global warming is to be expected as the population of the world increases, meaning  we need more homes ,roads, food, cars etc. but there is no reason to panic. Fossil fuels will gradually start to run out and become increasingly expensive.

    So plan ahead to develop renewable energy sources is great but no panicking regulation is needed just basic economics. 

    We should however rehab our nuclear power plants as this will probably be the most reliable way of generating electricity 

  • So no further information on the definition of ‘Global Average Temperature’.

    It is interesting that the lawsuit brought by the first major user of global average temperature is finally coming to court:

    ‘US climate scientist’s defamation case over online attacks finally comes to trial’

    https://www.theguardian.com/us-news/2024/jan/17/michael-mann-climate-scientist-defamation-lawsuit

    Dr Mann was responsible for the infamous ‘Hockey Stick’ global temperature curve.


    This is a fusion of several different measurement techniques that only represents the northern hemisphere. He was frequently challenged to produce the data sets and calculations to support the curve but refused to do so and when he was then called, amongst other things, a fraud he  started a defamation lawsuit.

    I am not quite sure how the US legal system will work here, does Dr Mann have to prove that he was correct or do the defendants have to prove that he was incorrect? As far as I can see this can only be resolved by bringing all the data into the public domain.

    The main challenge to this graph is the removal of the ‘Medieval Warm Period’ and the ‘Little Ice Age’ ,both of which exist in written history, and the statistical methods he used to achieve this.

  • wattsupwiththat.com/.../

  • Here we have another 'scary' graph from the BBC:

    World's first year-long breach of key 1.5C warming limit - BBC News

    This is based on 'Average Global Air Temperture' with the source quoted as ERA5 from the European Centre for Medium-Range Weather Forecasts:

    ECMWF Reanalysis v5 | ECMWF

    'ERA5 combines vast amounts of historical observations into global estimates using advanced modelling and data assimilation systems.' and is created by the

    'Copernicus Climate Change Service' 
    Is this a real global average temperature? Is it the data after reanalysis to meet the requirements of the climate change movement? The curve is much steeper that the NASA GISS curves In the original post, especially when the souther hemisphere is included
  • New Zealand north island Auckland area is having a really beautiful summer this year after the terrible weather last year. 

    https://niwa.co.nz/news/warm-oceans-behind-our-hot-humid-weather 

    Attached is the graph of pacific ocean temperatures which seem fairly normal although the article looks a little scary.

    Global warming is linked to population explosion which needs to be addressed particularly in countries where the average age is under 30

    https://www.worldometers.info/world-population/population-by-country/ 

  • According to an FOI request a significant proportion of the Met Office's weather stations do not meet the WMO requiremnets for accurate measurements. Nearly a third are in the 'junk' catagory with a potential error of up to 5°C. How do the stations in the rest of the world stand? How good is our key data?

    EXCLUSIVE: A Third of U.K. Met Office Temperature Stations May Be Wrong by Up to 5°C, FOI Reveals – The Daily Sceptic

  • Well done Roger. Temperature measurement today are corrupted by location, heat island effect and by thermostats with no inertia (Mercury max min)

    As you clearly show there is no such thing as a global average temperature. This concept does not mean anything. Anyone claiming otherwise is lying.