How can these 3 F currents be flowing in the opposite direction to the main current? I just don't get it a current as to come from somewhere ie something has to create it so where does it come from? Perhaps I should ask are these currents real or just a mathematical thing
Well the glib answer is that it is a mathematical thing, in the same way that volts and amps are a mathematical thing that allows us to measure and then predict the behaviour of systems, but what we have really is moving electrons and the fields and waves they produce to influence each other, probably.
Butt you know that, I think, and it is not so helpful in this example.
With a rectifier and capacitor power supply, what you really have is almost no current for all the part of the sinewave that is less than the voltage on the capacitor, and then a sudden burp of current for the ten or 20 degrees of the cycle near the crest (as you note pos and neg crests, for a full wave rectifier like a bridge).
So the current is very peaky near the crests of the incoming supply. By the same token , as there is less load near the zero crossing, and up the flanks until the current flows, the voltage is like a sinewave of a higer voltage at the sides, and then flat-topped as the current starts to flow.
Now an arm wavy picture like this and photos of a scope are all very well but to allow us to deduce how much filtering we need to mitigate this, and hw these waveforms will affect transformer windings etc we need a description that can be mathematised.
V = V0.sin(2pi.F.t) is the basic sine wave as a function of time, and if you were to make a spreadsheet of values of time and plot the result you would see our familiar sine wave.
V = V0.sin(3.2pi.F.t) is the form of the 3F waveform.
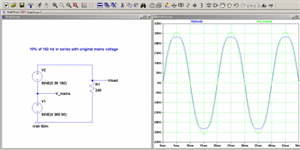
To make a model approximation to the rectifier voltage waveform you need say 10% of the 3F
V = V0(sin(2pi.F.t) + 0.1 .sin(3.2pi.F.t) )
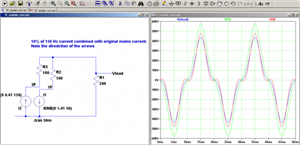
But for the current you want cancellation at the low flanks and addition at the peaks, so
V = V0(sin(2pi.F.t) + 0.1 .sin(3.2pi.F.t) )
It is an approximation, for modelling use and not perfect. Consider the following circuits and waveforms, and see if it helps you tie up the maths with the physics.
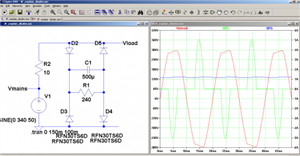
One 'realistic' circuit, and the rather idealised view of the models for voltage and current.
Note the average load current is much lower than the peaks that only flow during the sine wave crests.
I have added some 'wiring resistance' so we can plot the current in it and the volts accross.


We're about to take you to the IET registration website. Don't worry though, you'll be sent straight back to the community after completing the registration.
Continue to the IET registration site