This discussion has been locked.
You can no longer post new replies to this discussion. If you have a question you can start a new discussion

Meter accuracy

I recently purchased 2 little voltmeters they look like the sort that would go in a control or instrument panel they are connected with just 2 wires which provide the operating supply ( they light up green and red) however the green  one states it will work between 20and 500 volts and the red one between 60 and 480 volts. When they are both on the green one indicates normally around 241 volts the red one shows 235 volts why the discrepancy I know it's not much but makes you wonder if one of them is lying. Secondly I've noticed that the green one tracks voltage changes faster than the red one and that a few times the green one jumps down to 238 then up to 241 multiple times while the red one stays the same and I think can see a slight flicker in my filament lamps when this is happening incidentally both meters are connected to the same plug  a 2 pin 5 amp one
  • One of the problems is that GPS jammers (that deny a signal) and the more expensive spoofers (that make it look like you are somewhere else) are surprisingly simple pieces of kit, and have a huge advantage in not needing much transmit power, being a lot closer to the earth than the actual satellites,  that have to be run with the lowest sensible transmitter power, being solar powered.

    So the jammers have a huge advantage, and while having one is a serious offence , to find the small and often battery powered things can take quite some time, and if used sparingly, they may simply not be found at all. They are sometimes used, maybe in conjunction with mobile phone jammers, by criminals to confuse and delay the arrival of police etc, and less seriously by some van and lorry drivers to confuse company tracking systems, so it is not obvious that they have been visiting a girlfriend or doing a private job when they should have been somewhere else.  (think as of you Sat nav as calculating your position from the stars, but they are artificial stars that we put up there, and they broadcast their locations so it is done by timing to deduce distance, rather than angles, the jammer is something like a floodlight in front of the telescope, while the spoofer is more like a carefully controlled firework display that looks a bit like a different constellation.)

    The most likely explanation for your non existent movement is that a vehicle with one was driven past while you were working. Mercifully, such events are rare, but far from unknown.
  • Former Community Member
    0 Former Community Member
    From a popular well known multifunction installation tester accuracy specification for voltage measurement in the range 10 to 600 Volts:

    ±3% ± 1 V ±2 digits


    Assuming a three digit display, a true value of say 230 Volts could be displayed as between 220 and 240 ie 4.3% potential error

    Assuming a three digit display, a true value of say 55 Volts could be displayed as between 50 and 60 ie 10% potential error


    I don't know if it has a 4 digit display but you get the idea!


    Some accuracy specification has the initial +- % as a function of the range selected so using the same 3% as before, you could have an 18 Volt error plus 1 plus 2, ie 21 volts on any applied voltage..............


    Regards


    BOD

  • Sparkingchip:

    That sounds like a question for one of the sailors!


    A trough.

  • flat tops and over steep sides are typical of the voltage on rectifiers driving capacitor input circuits or charging batteries. The associated current is lower than you might expect on the flanks, and then higher on the peaks.

    This is sometimes referred to as  a "3rd harmonic" -  and if you sketch a sine wave, and then another one at 3 times the rate, and add a bit of the 3F to the basic wave, you will see depending on the phase you can get different effects. So if the zero-crossing of the main sine wave is in phase with a zero crossing on the 3F, that they re-enforce at the flanks, giving over steep sides, but by the main cycle is coming to the top, the 3F is on the way down again, so when you add the top gets either a flat top or a slightly bouncy depression.

    If you start the 3F in anti-phase with the main sine wave and repeat the sketching exercise, you will see that the flanks are now delayed, and then the main wave peak is added to the 3F peak  giving a ripply flat near the zero crossings and a significant up-tick at the peaks.


    So it is often said in passing, that the rectifier wave-forms can be mathematically modeled as a sine wave plus a 3F component,  that is in phase on the voltage, but the 3F current flows the opposite direction to the main current.


    The problem with 3F is that shifted by  1/3 of a cycle it looks the same on all 3 phases, so with identical loads on all phases the neutral currents do not cancel, causing odd effects at star-delta transformers.

  • Former Community Member
    0 Former Community Member
    There is a forum member who borrowed a highly accurate GPS speedometer designed to accurately determine the performance of a car on a track rather than for avoiding a speeding ticket on a road. So we may have someone with a detailed knowledge and experience of recording vehicle speeds with GPS amongst us.


    Yes it was BOD! I bought a "performance box" to see if I could crack 0 to 60 in under 5.5 seconds but decided that to confirm it, it really needed more abuse of the manual drive train than I was prepared to pay for...........Really a legacy from my boy racer days when a friend with an MGB was adamant that it would do 110 mph which was about 7 mph more than Autocar and other magazines had managed! I found the road test and how many mph per 1000 rpm in top which showed the speedo error correlating his claims and he found that the tachometer was more accurate to determine speed. It would be poor of me to suggest a generous overeading of mph (and thus total mileage recorded) was intentional to make the car appear faster and do more mpg whilst getting the tachometer as accurate as possible to extract maximum performance! This all alters of course when the tyres wear down................... Talking of which, lorries limited to 56 mph? Not if as I saw when doing an EICR at a testing station where the haulier fits just legal tyres to the lorry prior to re-calibration and lean on the guy to err on the higher side of 56, ie 56.9 when calibrating. They can get 59 mph on new tyres............


    Yet to compare my Sat Nav with the performance box (same brand as the track and car magazines use) but the spec assures me that it gives altitude and incorporates this in giving speed. Sampling rate is also greater at 10/second. Perhaps we can find a hill on the way to Elex Andy and compare?!


    Regards


    BOD

  • mapj1:

    [snippage]


    The problem with 3F is that shifted by  1/3 of a cycle it looks the same on all 3 phases, so with identical loads on all phases the neutral currents do not cancel, causing odd effects at star-delta transformers.


    Indeed I've seen neutrals specced to be 3x the size of the lines, in IT data centres and so forth (Not that I've ever done any wiring in such places, just I follow such things with interest) effectively making it 3 single phase circuits. Because of harmonics. I imagine with our rapidly evolving power usage this is of serious concern to DNO's and such like?


    Even back in the late 80s when I was training at a large university on the maintenance dept, there were issues with harmonics around the computing services  floor (back then it was a single floor of the maths building) I recall being told to hold on to the 95mm2 singles feeding the busbar trunking and asked if i thought that heat was normal

  • How can these 3 F currents be flowing in the opposite direction to the main current? I just don't get it a current as to come from somewhere ie something has to create it so where does it come from? Perhaps I should ask are these currents real or just a mathematical thing  I hope you can see where I'm coming from on this. Finally I hope these neutrals that mh was asked to hold onto were well insulated I know it's supposed to be safe but think my bottle would go if I was asked to do the same
  • I went to a youth club several years ago where they had a fan heater trying to cool down the DNO intake, someone had decided to put their large commercial kitchen all on the same phase as “that’s what the reqs requires”, that was very hot, with the neutral tail being significantly hotter than the line tail.


     Andy B.
  • The factory where I used to work back in the dim and distant had a portable fan cooling the DNO input as well this was an 800 Kva 440 volt supply for the anodising unit you could fry an egg on the cables

  • How can these 3 F currents be flowing in the opposite direction to the main current? I just don't get it a current as to come from somewhere ie something has to create it so where does it come from? Perhaps I should ask are these currents real or just a mathematical thing


    Well the glib answer is that it is a mathematical thing,  in the  same way that volts and amps are a mathematical thing that allows us to measure and then predict the behaviour of systems, but what we have really is moving electrons and the fields and waves they produce to influence each other, probably.

    Butt you know that, I think, and it is not so helpful in this example.

    With a rectifier and capacitor power supply, what you really have is  almost no current for all the part of the sinewave that is less than the voltage on the capacitor, and then a sudden burp of current for the ten or 20 degrees of the cycle near the crest (as you note pos and neg crests, for a full wave rectifier like a bridge).

    So the current is very peaky near the crests of the incoming supply. By the same token , as there is less load near the zero crossing, and up the flanks until the current flows, the voltage is like a sinewave of a higer voltage at the sides, and then flat-topped as the current starts to flow.

    Now an arm wavy picture like this and photos of a scope are all very well but to allow us to deduce how much filtering we need to mitigate this, and hw these waveforms will affect transformer windings etc we need a description that can be mathematised.

    V = V0.sin(2pi.F.t)  is the basic sine wave as a function of time,  and if you were to make a spreadsheet of values of time and plot the result you would see our familiar  sine wave.

    V = V0.sin(3.2pi.F.t)  is the form of the 3F waveform.


    To make a model approximation to the rectifier voltage waveform you need  say 10% of the 3F

    V = V0(sin(2pi.F.t)  + 0.1 .sin(3.2pi.F.t) )


    But for the current you want cancellation at the low flanks and addition at the peaks,  so


    V = V0(sin(2pi.F.t)  + 0.1 .sin(3.2pi.F.t) )


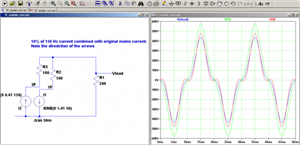
    It is an approximation, for modelling use and not perfect. Consider the following circuits and waveforms, and see if it helps you tie up the maths with the physics.

    One 'realistic' circuit, and the rather idealised view of the models for voltage and current.

    Note the average load current is much lower than the peaks that only flow during  the sine wave crests.

    I have added some 'wiring resistance' so we can plot the current in it and the volts accross.
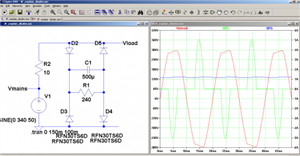
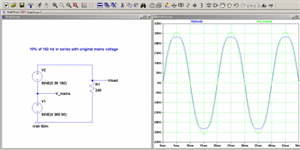
    fd54bdafc73f9fb088406ca7af3844a7-huge-3f_explain_diodes.png


    f6b77dbfda1d69d5dd75808b87529636-huge-3f_explain_voltage.png
    d67ecc46ca270256f431d2973c63eb2b-huge-3f_explain_current.png