This discussion has been locked.
You can no longer post new replies to this discussion. If you have a question you can start a new discussion

European Blackout - January 8th 2021

Forgive me if this posted elsewhere here, but just came across the following on a Time Dissemination forum I frequent from a German poster.

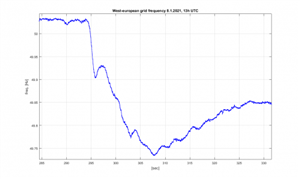
On Jan.8, 13:04:54 UTC, the european grid frequency dropped from 50.0269Hz to a minimum of 49.7343Hz 13.4sec later, see fig 1 below, plot starting at 13:00, x-axis in sec. .

As a result southeast Europe was split from the rest, the frontier crossing the Balkan countries, see
https://www.entsoe.eu/news/2021/01/15/system-separation-in-the-continental-europe-synchronous-area-on-8-january-2021-update/

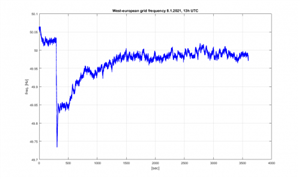
At 13:42:35 the western frequency was back at the 50Hz level, some time later they managed to resync the east and reconnected. Reasons are still under examination. A high western demand faced a southeastern production, so after the split the western frequency went down, the eastern frequency went up.

At 79/50 sec. after the event the primary control kicked in at 49.9035Hz and brought it up again to 49.9308 but eventually failed, see fig   2. below.

In the 13. hour that day they failed to deliver 112 sinewaves. Now ENTSO-E has to decide: readjust the wall clocks in Berlin or Athens?   )

Reportedly at a frequency below 49.8Hz big loads, like pumps for reservoirs or industrial customers are switched off automatically.

In 2011 the German Government launched a scenario for a blackout, detailed as a script:
https://www.tab-beim-bundestag.de/en/publications/books/petermann-etal-2011-141.html


Clive
f78d55e118b9b0d15fb9e7890397a312-huge-fig1.pngc
780060cda814b163f7e49f3827bd2f76-huge-fig2.png
Parents
  • Although in the UK perhaps surprisingly, it spends a shorter time close to frequency, and quite a lot of time either above or below and then flips between the 2 states,  plots of frequency density (that is the fraction of the time that each frequency component is present )

    show a slightly 'rabbit ears' distribution, with a depression in the centre and extending slightly on either side of perfect 50Hz.

    I have read an explanation for this in terms of the way the frequency control is done-  to avoid excessive switching, and associated costs , once connected, extra generation is not removed until clearly above the target, nor is extra added until clearly below.

    Even so, it is pretty tightly bunched. Genset owners can only dream of this sort of precision.
    8d1f17e27b1bba736980ccd7a545e263-original-uk-mainsfreq.png

    A typical plot based on 1 minute cycle counts over a 24 hour period. If measured over shorter intervals, the variation is wider - you may see 49.7 or less or 50.3 or above for a few seconds during any one minute.

    M.
Reply
  • Although in the UK perhaps surprisingly, it spends a shorter time close to frequency, and quite a lot of time either above or below and then flips between the 2 states,  plots of frequency density (that is the fraction of the time that each frequency component is present )

    show a slightly 'rabbit ears' distribution, with a depression in the centre and extending slightly on either side of perfect 50Hz.

    I have read an explanation for this in terms of the way the frequency control is done-  to avoid excessive switching, and associated costs , once connected, extra generation is not removed until clearly above the target, nor is extra added until clearly below.

    Even so, it is pretty tightly bunched. Genset owners can only dream of this sort of precision.
    8d1f17e27b1bba736980ccd7a545e263-original-uk-mainsfreq.png

    A typical plot based on 1 minute cycle counts over a 24 hour period. If measured over shorter intervals, the variation is wider - you may see 49.7 or less or 50.3 or above for a few seconds during any one minute.

    M.
Children
No Data