davezawadi (David Stone):
Graham, I do not understand what you mean. Circuit breakers and fuses give curves for 0.1 to 10,000 seconds. Time to trip or fuse under various "overcurrent" conditions can be very useful, particularly for mechanical loads on motors. BS7671 applies in all installation areas, it may not present data for higher current installations, but has all the principles and regulations for all sizes of jobs. It is true I consider the circuit breaker data on the graph grossly misleading, and it has obviously misled Andy, but manufacturers data can also have the same defect. I wonder if you think that operating a fuse at greater than its "fusing" current is in some way incorrect, the continuous rating of a circuit may be very different from short term conditions, for example for motors starting with a high inertial load, or large incandescent lamps or heating elements.
The graphs in BS 7671 are only the RHS of the "area" described by the range of real fuses (or circuit breakers) that come off a production line. So, whilst they are useful for some things, they are not useful for others, such as selectivity, or determining whether a "keen" fuse towards the LHS of the range will operate due to a motor starting under load. Compare the time/current characteristics of fuses shown in BS 1362, which show the whole area for 3 A and 13 A fuses: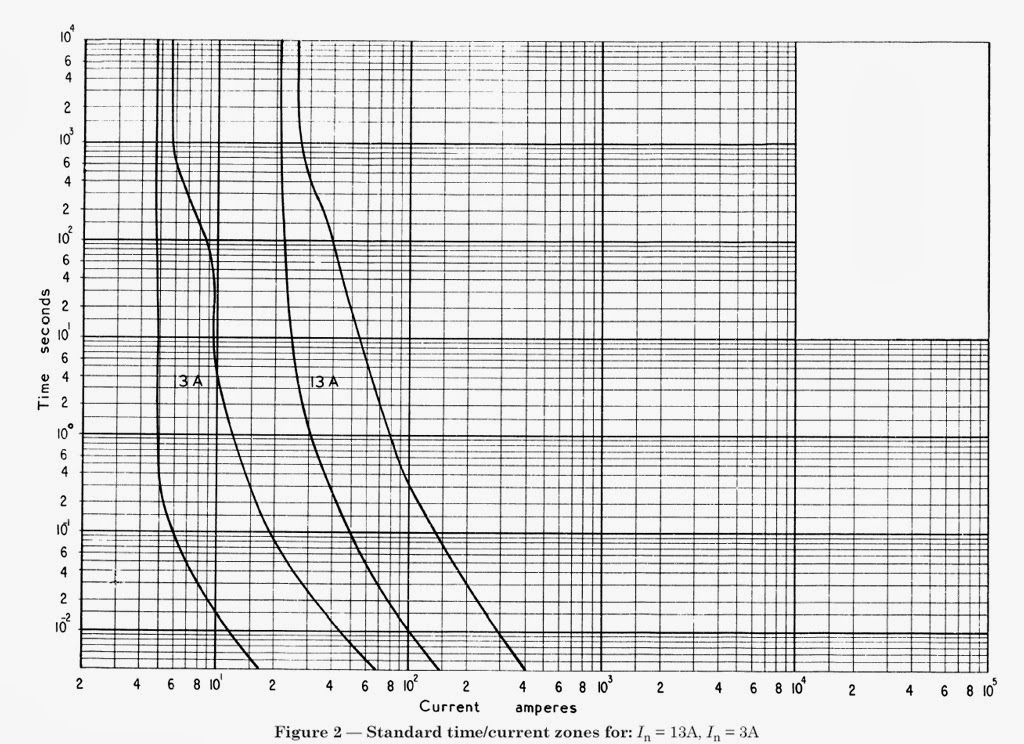
We're about to take you to the IET registration website. Don't worry though, you'll be sent straight back to the community after completing the registration.
Continue to the IET registration site
