Ipf result

Not sure what to record! 

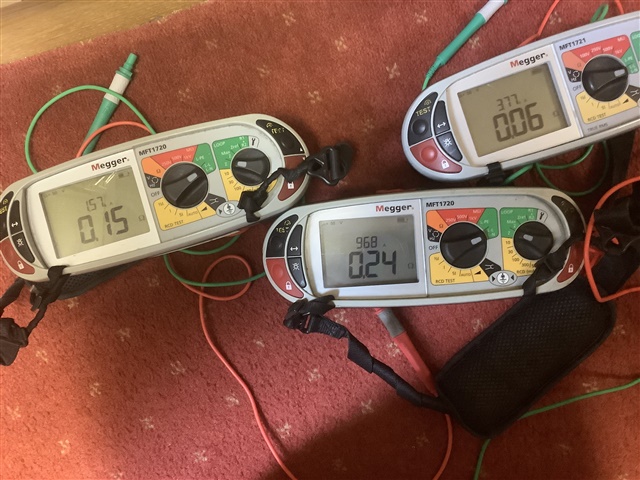
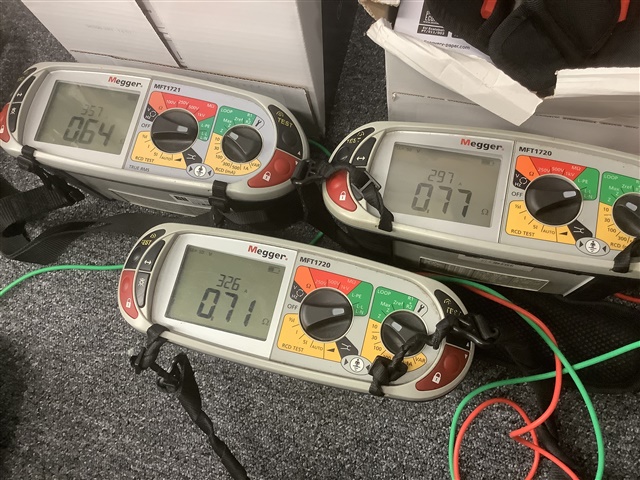
All calibrated around the same time. Three readings taken on each instrument with swapped leads and probes all fairly consistent with photo.

Then move to a socket opened up using same leads;

Parents
  • I did consider the SoC, and cannot comment on noise. However, you will note at the higher impedance the % deviation from average is 9.4 while at the lower end somewhere in the order of 60%. 

    We have a 1741 + but it was not on site.

    Previous result recorded by me on a different instrument 5 years ago was 1.58x2. 

    Will commence experimenting at the training centre during 2391 where we have access to a board close to the intake.

  • at the higher impedance the % deviation from average is 9.4 while at the lower end somewhere in the order of 60%. 

    Or a difference in range of 0.18 Ω, giving a deviation of ± 0.9 Ω from median.

  • at the higher impedance the % deviation from average is 9.4 while at the lower end somewhere in the order of 60%. 

    Or a difference in range of 0.18 Ω, giving a deviation of ± 0.9 Ω from the centre of the range.

    I guess what this experiment illustrates is that:

    • Loop impedance testers are not accurate at low values of Zs / high values of Ipf (which we already know) - what we don't know I guess is what the real reading is.
    • 3 instruments is not a large enough population to gather statistics in measurement uncertainty.
Reply
  • at the higher impedance the % deviation from average is 9.4 while at the lower end somewhere in the order of 60%. 

    Or a difference in range of 0.18 Ω, giving a deviation of ± 0.9 Ω from the centre of the range.

    I guess what this experiment illustrates is that:

    • Loop impedance testers are not accurate at low values of Zs / high values of Ipf (which we already know) - what we don't know I guess is what the real reading is.
    • 3 instruments is not a large enough population to gather statistics in measurement uncertainty.
Children
No Data