
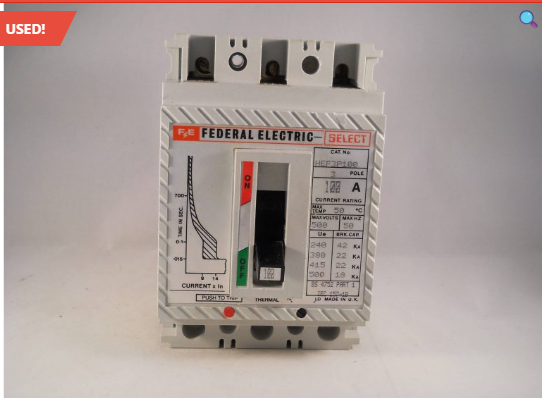
HI All,Can some one explain the 9IN and 14IN on these please. Is not relating to 5 seconds and 0.4 by chance? I can not find any info on them. any help would be greatful.


HI All,Can some one explain the 9IN and 14IN on these please. Is not relating to 5 seconds and 0.4 by chance? I can not find any info on them. any help would be greatful.
Looks like the magnetic trip at 9–14 × In (900–1400A instantaneous trip)
HI, would 9 be for 5 second disconnection? I can calculate the The maximum disconnection then. That is what my thought is.
9 will be 0.01–0.1s. I would say more like x3 for 5 seconds disconnection, 0.66 ohms
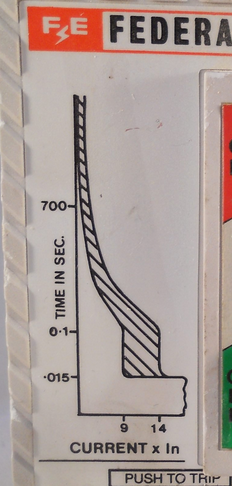
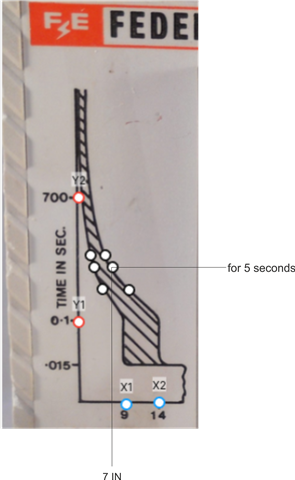
The two lines with shading between represent the never trip (left of shade) and always trip (right of shade) curves of time vs current - and both get faster at higher current.
The reason for both sides of the shaded region is to ensure proper discrimination with lower rated devices on sub-circuits supplied by these. Any fuse or breaker device whose 'always trip' curve is to the left of the 'never trip' line of this one, should allow fault discrimination - in the sense that only the lower rated breaker or fuse should operate. In practice this is not always true because it depends on other loads, but it was the practice of the day, and something similar still is on larger installations, albeit probably using Amtech or similar software.
Any real in-spec device could trip off anywhere in the shaded zone.
To be absolutely sure of a trip, you need your PSSC to the right of the shaded zone, at horizontal 5 sec mark. Given the highly non-linear y axis, I'd be very wary of using the image on the breaker itself there are nearly 3 orders of magnitude between 100ms and 700 seconds, if you really need to know, you need the makers data. Which could be awkward, as they have not been made for some time.
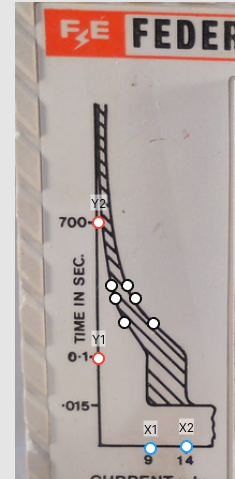
If we must use that figure then the white dots are near where 1 second, 5 seconds and 10 seconds would be, and the current multipliers on the RHS would be about 6.In for ten seconds, 7.In for 5 seconds and 9,5.In for 1 second, based on a simple log lin axes best fit (using https://plotdigitizer.com/app)
Here be dragons, I'd not really trust anything based on measuring what is probably more of an artistic impression of the right curves than formal data. Equally I'd not like to assume it's a simple adiabatic inverse time integral either.
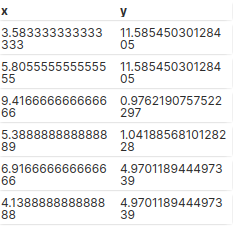
The actual coordinate pairs from the 'plotdigitizer' curve-fitted overlay.. (x= current as In multiplier, y=t ) Ignore anything beyond the first significant figure and a large pinch of salt I think.
regards Mike
 Thank you for your reply. I do see the issue of the image and its scaling off this picture. I was working on the 9IN for 5 seconds. If i used your 7 IN with 20% tolerance it puts me at 8.4 N. So I will stick with the 9IN and note it. Not much I can put on paper work.. I will say again many thanks for all your input.Its good to know there is help out here. I also take it 14 IN is 0.4 seconds. Although not required for the install its in.
Thanks for your reply.
Mark
Also How does the HI / LO setting effects it?
Also How does the HI / LO setting effects it?
We're about to take you to the IET registration website. Don't worry though, you'll be sent straight back to the community after completing the registration.
Continue to the IET registration site

