
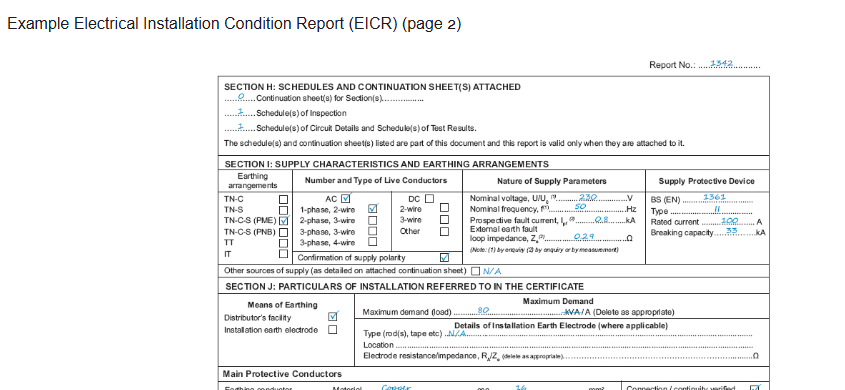
I have just noticed this change requiring the maximum demand to be stated on the new EICR template. Is this possibly a copy and paste mistake or is there a rationale behind it?
I have just noticed this change requiring the maximum demand to be stated on the new EICR template. Is this possibly a copy and paste mistake or is there a rationale behind it?
Hi,
But what time duration is used to calculate "maximum"?
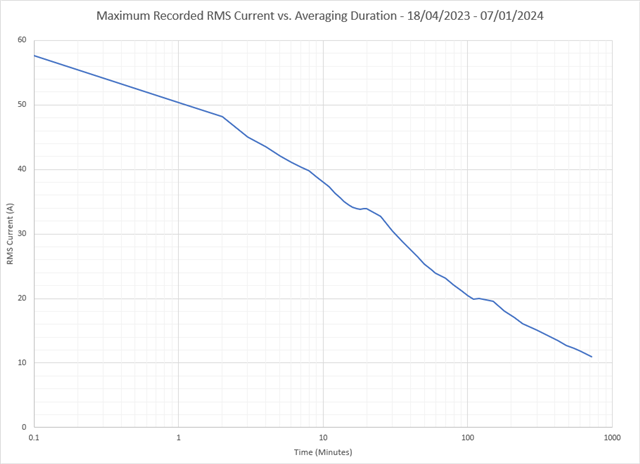
To take some data I have for my own property, what is the MD here?
At the time this data was recorded there was a 60A DNO fuse.
For those who want to attempt an answer based on the OSG guidance, there was a CU with breakers as follows:
Shortly after the data was recorded the DNO fuse was changed to 80A - did that change the MD?
After the 80A fuse was fitted, a 32A car charger was installed - is the MD 80A? Did the car charger need to incorporate load limiting or could a MD of 70A, including the charger, have been declared based on the 10 minute maximum RMS without any limiting?
Is using the recorded data sensible? The usage reflects my lifestyle - someone else living with the same electrical installation might have a very different MD.
I'm happy to use engineering judgement to answer the above questions but I suspect that there won't be a single right answer to each...
I'm happy to use engineering judgement to answer the above questions but I suspect that there won't be a single right answer to each...
Agreed, 100 %.
Shortly after the data was recorded the DNO fuse was changed to 80A - did that change the MD?
Not necessarily, but it might affect the InA rating you ought to select for a consumer unit to BS EN [IEC] 61439 series if you install microgeneration such as PV and/or energy storage.
representing the power over time as a cumulative probability density like that is actually a very helpful method.
One can then draw lines of constant time (vertical) or for things like heating cables or fuse-links lines of constant I2t and compare, as well as breaker curves. (the time constant for an oil filled transformer being some hours, and for buried cable at least half an hour.)
In terms of thermal stresses this representation shows the worst case - in reality often a burst of high power will not be followed by a burst of only slightly lower power, but by a lot less, allowing for some cooling down.
But, it would be quite fun to overlay that with a C type breaker curve, and see that your whole house could just about manage on a 32A breaker and certainly a 40A one I think. I'm not too sure about that, as the area under the curve does not seem to integrate to the 9 months I was expecting. But that is probably my failing to grasp some subtlety.
Mike..
Hi,
The graph doesn't represent all the data - it is constructed by taking 1 minute RMS data and then using that to calculate the RMS for 2, 5, 10, 30, 60, 90, 120, etc. minute blocks with each minute at the centre over the 9 month period. The greatest value for each duration is then plotted on the graph. The metering I am using also measures a "maximum" value for the minute - I'm not sure what time that is measured over so I plotted that at the 0.1 minute point for convenience.
As you note, the graph doesn't give any indication of cool down time (other than an absolute worst case) - there is no guarantee that, for example, the 90 minute RMS figure and the 120 minute figure are from overlapping measurement periods.
It is also useful to pick an RMS averaging duration and plot frequency against current - that is helpful if you know exactly which averaging duration you are interested in (and would represent the whole data set). I suppose a pretty 3D surface could be plotted if you wanted to see all averaging durations against frequency at once - I'll have a go one day if I have spare time.
I see, yes- and also there will of course be really short inrush events with peak currents many times all of that - but as these are just the motor start for the fridge or the flat capacitor of the LED lights charging at switch on, while it may be 100A plus, it won't last long enough to trouble the score in terms of tripping or cable heating.
I can also see a variation of that sort of representation being very useful for cable ageing studies - possibly using I2 rather than I as the vertical quantity.
Mike
A meter at a property in working at tell you what I presume is the maximum demand on its screen.
We're about to take you to the IET registration website. Don't worry though, you'll be sent straight back to the community after completing the registration.
Continue to the IET registration site

