Mapping Accessibility in UK Cities
The lecture was presented by Duncan Smith, Associate Professor in GIS and Visualisation at the Bartlett Centre for Advanced Spatial Analysis (CASA), UCL.
The lecture, held on Wednesday 13th May 2026, took place at the flagship IET venue at Savoy Place, London, in the Turing Theatre.
The lecture primarily covered transportation challenges that we all face on a daily basis.
Transportation Challenges: Sustainability, Productivity & Health
Transport is a major source of greenhouse gases (GHGs) and is also vital to the economy. The talk presented these issues effectively through the analysis of tabulated data.
It provided an interesting perspective on how transport accessibility impacts our daily lives.
Transport is something we all rely on every day—whether commuting to work, accessing services, or connecting with our communities. Yet beneath this routine lies a complex system facing growing pressure from sustainability demands, productivity challenges, and public health concerns. This lecture offered a valuable framework for understanding these issues through accessibility, mapping, and urban design concepts such as the 15-minute city
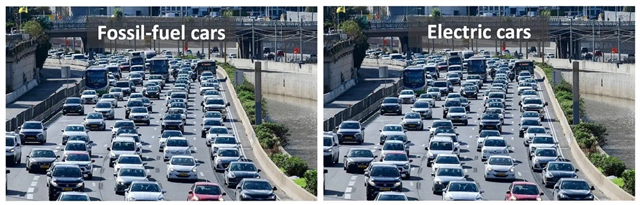
The topic is highly relevant given current challenges around fossil fuels and the transition to electric transport.
Key Observations
- Lower-cost electric cars still contribute to congestion
- Uptake of electric cars has been relatively slow, although public transport has made progress through electrification (trains, trams, and buses)
- Transport remains heavily dependent on fossil fuels
- Electric vehicles are not a complete solution, as their manufacture (including batteries) produces significant emissions
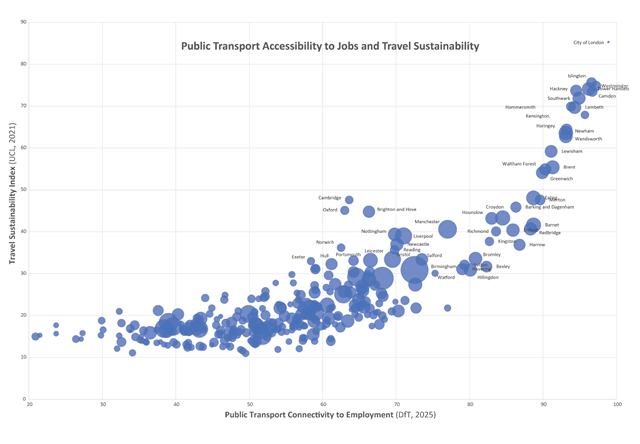
Transport networks directly influence access to jobs, education, and services. In the UK, a significant proportion of the population has limited access to employment within reasonable travel times, particularly outside major urban centres.
Poor connectivity reduces productivity, restricts labour markets, and reinforces regional inequality. Reliable and accessible transport networks are therefore critical for economic growth.
Transport also has significant impacts on physical and mental health. Systems dominated by cars contribute to air pollution, inactivity, and road safety issues. In contrast, prioritising public transport, walking, and cycling can improve fitness, reduce emissions, and enhance community wellbeing.
Duncan’s research introduced agglomeration, describing the clustering of population and economic activity in cities and urban areas.
Additional points highlighted:
- Domestic transport accounted for 37% of accessibility and plays a key role in economic growth
- King’s Cross in London is a strong example of urban regeneration attracting major organisations (e.g. Google, Meta AI, DeepMind)
- Public transport is vital for those without access to a car—around 23% of households do not own one
- Car dependency contributes to obesity and long-term health issues, impacting NHS resources
Urban design must balance infrastructure for cars, public transport, and cycling to support effective movement within and between cities.
Understanding Transport Network Quality using Accessibility
Traditional methods measure transport performance using speed or congestion. However, a more meaningful metric is accessibility—the ease with which people can reach jobs, healthcare, education, and other services.
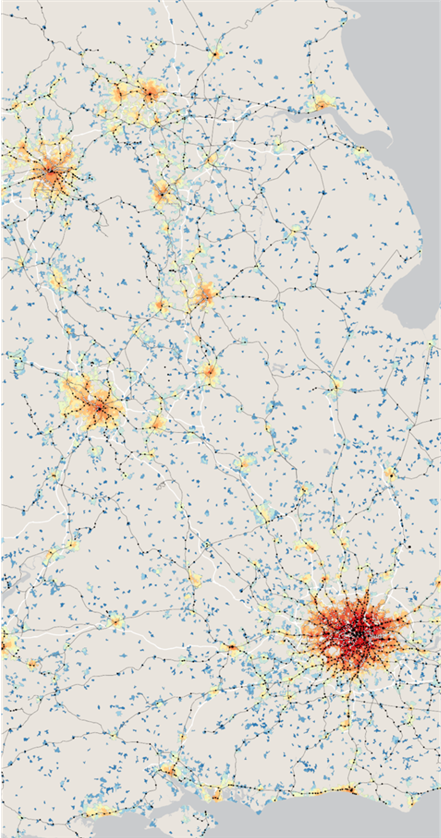
Spatial mapping of the South East showed that transport is significantly more accessible within major urban centres. In contrast, many areas remain dependent on car travel.
Key insights:
- Uneven investment leads to disparities in accessibility
- Travel times (e.g. 30 minutes to reach schools by bus) highlight limitations in some regions
- Agglomeration economies have created high-density centres of wealth in cities such as London and Manchester
- Integrated transport systems (rail, tram, and bus networks) improve connectivity, as demonstrated in Manchester
Mapping Accessibility for UK Cities
Mapping accessibility enables planners to visualise how easily people can reach key services and identify gaps in provision.
In the UK, datasets and analytical tools now allow accessibility to be measured at detailed spatial levels, including access to:
- Employment
- Healthcare
- Retail
Spatial analysis demonstrates how connectivity varies across cities and regions.
Key observations:
- Travel behaviour differs between urban and rural areas
- Accessibility standards vary significantly between cities (e.g. London compared with Amsterdam)
- Policies such as cycle infrastructure and car-related charges are influencing behaviour change
Local Connections, Cycling & the 15-Minute City
The 15-minute city is an urban planning model where residents can meet most daily needs within a 15-minute walk or cycle from home.
This represents a shift from car-dependent planning to human-centred urban design, where:
- Workplaces, shops, healthcare, and leisure are easily accessible
- Walking and cycling are prioritised
- Neighbourhoods become more self-sufficient
The aim is not to restrict movement, but to reduce the need for long journeys.
Behavioural Changes
- Post-pandemic trends such as remote working (WFH) and online shopping have reduced travel demand
- Local accessibility has improved in some town centres
- However, walking to work remains challenging in many areas due to job centralisation
Role of Public Transport & Cycling
- Public transport supports access into cities, with walking enabling mobility within them
- Manchester provides a good example through integrated bus and tram networks
Cycling remains a challenge:
- Only around 2% of journeys are made by bicycle
- Around 4% of commuting journeys involve cycling in England and Wales
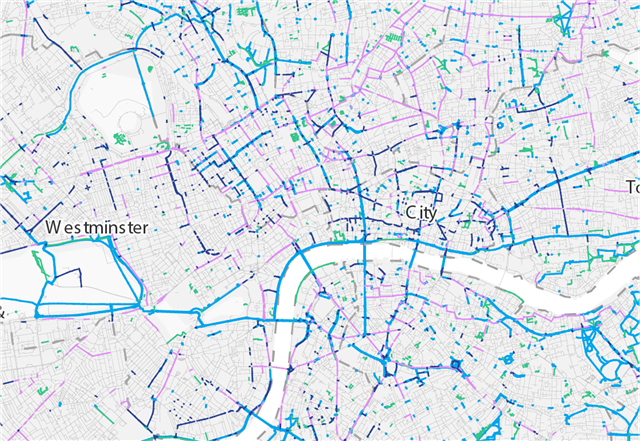
- Many roads lack cycling infrastructure, traffic stress and road design create barriers to cycling.
Conclusions
Sustainable transport offers significant economic and health benefits.
An accessibility-based framework provides a more effective way to understand how people connect to jobs and services.
Key conclusions:
- Accessibility mapping highlights inequalities and opportunities for improvement
- Land use and transport planning must be integrated, where there is high density ,strong public systems are a required.
