
In our previous post, we unveiled the exciting world of Predictive Maintenance, exploring its potential and practical applications. If you didn’t read it already, the link is here (Unlocking the Power of Predictive Maintenance - Part 1: The Promise and Challenges of Predictive Maintenance).
In this post, we dive deeper into the data itself. We will uncover the intricacies of the data involved, the challenges it presents, and the crucial steps needed to begin building predictive models.
The Collected Data
Once we’ve gathered the data, we need to start processing it. Whilst pre-processing to clean the data is essential, here we will just focus on the additional key aspects critical to Predictive Maintenance. Often, we need to reduce the data volume whilst preserving quality and features. This also helps us to increase the signal to noise ratio, which gives us better clarity and more useful distinguishable data from the irrelevant and noisy data. Aggregating data over differing time periods can achieve this as shown below.
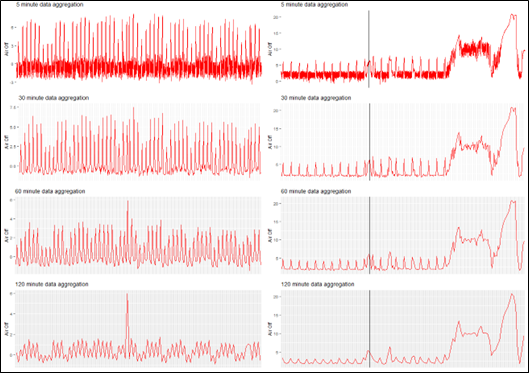
Figure 1: Visualisation of data aggregation for two assets – one with no failures (left), one with a failure (right).
On the left we see the telemetry trace for an asset with no failures, aggregated over different time periods. On the right we see the telemetry trace for an asset with a failure that was picked up indicated by the vertical black line, again aggregated over different time periods.
Through aggregation, we can see that noise is reduced in the data set, the volume of data is reduced, but the signal is retained and is actually visibly clearer. This therefore reduces the computational power needed to run the models and presents more valuable data to the models. The key challenge here is determining the optimal aggregation level that best suits the use case. This is often found by comparing the duration needed to get a fix for the asset vs the different aggregation levels, ensuring that the chosen aggregation level doesn’t result in the asset failing before it can be repaired.
Class Imbalance and Overlap
When we collect our telemetry data, we often take for granted that the majority of the data is normal and not associated with a failure mode for the asset. This leaves us with a bit of a tricky problem in that we end up with what is called a class imbalance. This means that we have far more normal telemetry data than we do for when the asset is in a failure mode, and that is because telemetry data for failure events is rare, and in reality, failure data accounts for less than 1% of the data we collect. This makes it challenging for Artificial Intelligence models to predict when the telemetry is indicating that an asset is close to failure as the models will tend to favour the majority class, i.e. normal data, and generalise to only predicting this as an outcome if we don’t account for this correctly.
Additionally, we can also find that when we do have failure mode telemetry, this data overlaps and is not too dissimilar to normal mode telemetry, making it difficult for the models to separate out the classes.
The good news is that there are a number of methods available to try and alleviate these issues which are listed and shown below.
Random Undersampling: Balances the classes in the dataset by randomly removing observations from the majority class, retaining all observations from the minority class. This reduces data volume and run times but risks losing valuable information.
Random Oversampling: Balances the classes in the dataset by randomly duplicating observations from the minority class. This retains all information but may cause overfitting, leading to poor generalisation on unseen data.
Synthetic Minority Oversampling Technique (SMOTE): Balances the classes in the dataset by generating new examples from existing minority class data, avoiding duplication but may increase class overlap.
Tomek Links Undersampling: A Tomek link is defined as two observations that are nearest neighbours of opposing classes. This method aims to remove observations from the majority class that form Tomek links until all nearest neighbour pairs of observations are of the same class to create a separable boundary. Even though a separable boundary can be defined, the method may struggle to build models suited to unseen real-world data where there will still be a class overlap encountered.
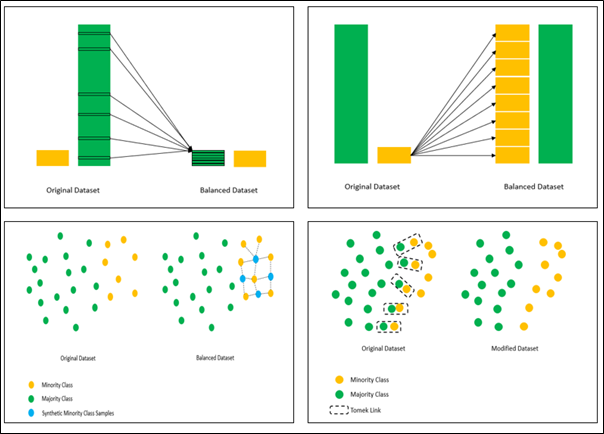
Figure 2: Visualisation of Random Undersampling (Top Left), Random Oversampling (Top Right), SMOTE (Bottom Left) and Tomek Links (Bottom Right)
While these methods all exist to try and alleviate the class imbalance and class overlap issues, the bad news is its often a case of building models that try all of these techniques which increases the complexity, time involved and computational resource to see which one works best for the dataset.
Classification vs Regression – Which Approach to Take?
Predictive Maintenance can be modelled two different ways: A classification approach or a regression approach.
Classification:
The classification approach takes the view that this is a binary problem, i.e. either a failure occurs, or it does not within the defined failure window, and the standard supervised machine learning methods are available to model this.
We aim to answer the question, can a failure be predicted within the next X units of time as given by the failure window? The data structure to frame this setup is shown below.
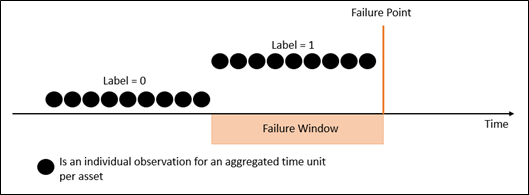
Figure 3: Visualisation of a classification data model setup
Regression:
The regression approach aims to actually put a timescale on when failure will occur, and is often known as survival analysis. With this approach, we aim to discover an underlying probability distribution that fits the time to failure data, with the understanding that the probability of failure changes with time and that certain scenarios can accelerate or decelerate this.
In this setup, we aim to answer the question, can the exact time to failure be predicted? The data structure to frame this setup is shown below.
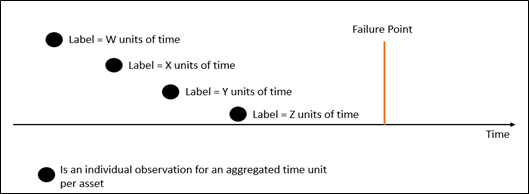
Figure 4: Visualisation of a regression data model setup
Both of these approaches have their merits, but its often after understanding your data, that the approach to take will become clear. What we tend to find is that where you can see trends towards failure, the regression approach is more suitable, and when the failures seem random, the classification approach is better off being used.
Summary
Understanding how to aggregate your data, whether to use classification or regression for model building, and addressing class imbalance and overlap are critical steps in building effective Predictive Maintenance models and are challenges that go unnoticed. Solving these challenges and incorporating the methods discussed go a long way in helping to get to a stage of deploying robust Predictive Maintenance models. In the next and final instalment, we will explore how to assess these models and their real world impact, gaining stakeholder buy in and other considerations that you may not have thought of.
