
Further comments anyone?

The findings have led to calls for a higher level of…
4 comments
Further comments anyone?

The artical is not too specific on the causes of the electrical fires and whether its with circuits or distribution boards..
I know there's bern massive increase in cheap and fake laptop chargers since the 90's.
Other factors are an increase generally in household gadgets, high powered items like ev chargers also.
Don't really see its a competence thing as that has been given a thorough makeover since part P. Plus online channels are freely available to watch and learn. Access to 'how to' video content has never been so easy.
The artical is a bit suspect, but then I'm a massive sceptic these days.
It may just be pure coincidence but I started my career in electrical installation in the late 80 's early 90's. I'll get my coat.....
Part of the problem IMHO is the inadequate wiring space in accessories and back boxes. In many cases the larger loading electric showers will need 10mm cable. It is almost impossible to fit two lengths of 10mm twin with earth correctly into an average pull-cord shower switch. Similar arguments apply to cooker control units.
Even socket outlets and standard back boxes do not readily accept 3 twin with earth cables each of 2.5mm.
A great many real world installations have the outer sheath of the cable terminating outside of the back box, for lack of space to do otherwise.
USA rules are superior in this respect, requiring a minimum wiring space in cubic inches.
Well I read it as implying part P should never have have introduced in the way it was, and it failed to achieve its objective and recovering from it has taken a reasonably significant relaxation of the rules in 2013-14 and that has needed ages to take effect.
We have more paperwork and perhaps more traceability but less folk out there just fixing stuff before it goes wrong.. We know that it removed from the pool of cheaper labour some experienced folk who maybe were approaching retirement, or operated in a small way that made registration uneconomic. That probably in turn meant that at the small jobs /pub electrician end of the market this left more of the less conscientious. Also perhaps the increase in the cost of small jobs that may have been borderline DIY being put off until never. If that is the reason, it is not without parallel - there was a slight but statistically significant reduction in accidents in New Zealand relative to Australia after they re-permitted certain types of DIY wiring in the 1990s.
There is a cost to regulation that requires a paper trail, if only the labout time lost to complying with it, maybe there is a higher cost too.
The important thing is not to let anyone use this to justify 'ah look we really need AFDDs' because it does not say that at all.
Mike

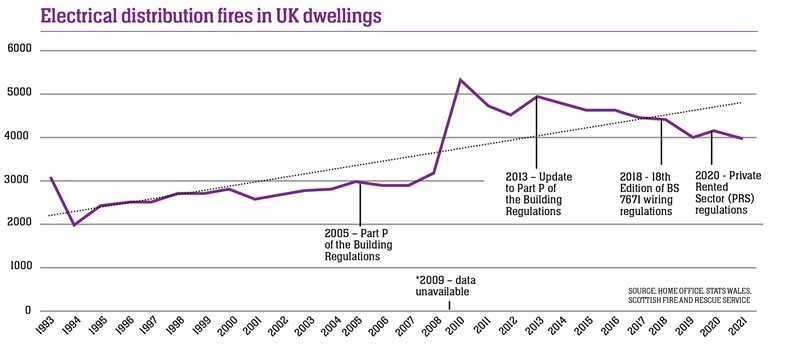
That graph showing fires jumping from around 3000 to 5000 per year within a year or two strongly hints at changes in reporting methodology rather than any actual increase or decrease in the safety of the electrical installations. Changes in training, part P etc are likely to take decades to work through into fire statistics, since we don't replace all wiring in all dwellings every year or two.
I agree and think that the assumptions being drawn from this graph are rather dubious, and personally I would draw the opposite conclusion from the same chart, i.e. electrical distribution fires have steadily declined by ~20% in the last 10-12 years since comparable records began.
The change in methodology midway clearly coincides with a substantial change in both magnitude and trend. Without any form of overlap between the two datasets they are not really comparable (the IET's write up seems to consider this also) and there is no attempt to account for this in the analysis... It smacks of analysis to support a point, rather than the other way around... Who is to say the trend is going to be linear over 30 years after all?
It also appears not to be normalised for number of dwellings, which will inevitably skew the results a little.
I made the AFDD point directly below the article Mike. It was my 1st suspicion. I can see the manufacturing lobbyists banging on the IET's door screaming about the lack of take-up of AFDDs and that something should be done about it. Drop a 'study' into the public domain about increased fires and let the scaremongers do the rest. Also agree about Part P, a most noticeable trend on the graph. I wonder if it been proofread properly before release.

I do have to wonder how much the increase has to do with the mass influx of third world people and the poor standards they are used to since 2002, and that they bring these in with them. I've seen enough ethnic food outlets and shops to make me wonder how more of their staff haven't been killed.
I agree! I have refrained from asking a question, about part P... but, briefly - I think it was a big mistake! WHY? Well, for one it pushed many so called 'sparks' beneath the radar and they had their mates, sign off their works, (meaning that this 'mate' didn't checkout what he was signing off), also... many couldn't be bothered making sure they were doing the works, correctly! As far as I am concerned, (not forgetting the RYB fiasco), part P was only about a money making exercise, for the colleges!
SORRY, I don't mean to sound offensive... just my take on what's going on! Thanks...
We're about to take you to the IET registration website. Don't worry though, you'll be sent straight back to the community after completing the registration.
Continue to the IET registration site

