
I have just noticed this change requiring the maximum demand to be stated on the new EICR template. Is this possibly a copy and paste mistake or is there a rationale behind it?
I have just noticed this change requiring the maximum demand to be stated on the new EICR template. Is this possibly a copy and paste mistake or is there a rationale behind it?
The other way of tackling this problem is to use actual maximum demand data for the installation - get the customer to obtain their half-hourly import metering data from their supplier, then you can use that to determine the actual highest average demand over a half-hour period, which might be a reasonable representation of the demand in thermal terms.
Potential weakness of that approach is it doesn't tell you the maximum instantaneous demand, or MD over shorter periods, or what the maximum demand might be under a different occupier (more people in household, different habits/routines affecting diversity etc).
But at least it is based on real, accurate data - settlement metering is accurate to within a couple of percent. Only fly-in-the-ointment is where there's solar/battery installed which then needs some more difficult analysis adjusting for solar/battery energy flows.
I'm surprised there's not a more formal, defined process for how Maximum Demand should be determined because with it being inherently probabilistic, rather than purely deterministic, it opens up the space for significant differences in how different people might determine the value, the electrical equivalent of 'how long is a piece of string?'.

The other way of tackling this problem is to use actual maximum demand data for the installation - get the customer to obtain their half-hourly import metering data from their supplier, then you can use that to determine the actual highest average demand over a half-hour period, which might be a reasonable representation of the demand in thermal terms.
Interesting idea, but would that not require a smart meter?
Moreover, presumably, it is the electrician's job to get the info.
I'm surprised there's not a more formal, defined process for how Maximum Demand should be determined
In which case, the term is pretty meaningless.
30A per 1000ft² (or 32A per 100m²)
what the maximum demand might be under a different occupier
That formula puts us well beyond the rating of the DNO's fuse, but there are only two of us, so most rooms are unused most of the time.
Of course that could change markedly when we sell/leave feet-first.
Interesting idea, but would that not require a smart meter?
Moreover, presumably, it is the electrician's job to get the info.
Yes but most homes already have smart meters and ultimately all homes will have them, so I don't see that as a problem in the longer term.
I don't know what it's like with all suppliers, but some already have a function for the customer to download their half-hourly data, so it's a simple job to then just find the maximum value, or rank them to find the top X half-hour periods.
Either way, now that smart metering is available and half-hourly data from them is increasingly available, it seems only logical that the Wiring Regulations ought to reflect this to make more accurate, data-driven assessments of MD,
Yes but most homes already have smart meters
It's still only at 70 % in the UK I believe. Technically "most" but still around 30 % that don't.
ultimately all homes will have them, so I don't see that as a problem in the longer term.
That will almost certainly be the case, because even though there's no legal requirement (yet), the fact is that meters have a finite life, and the options for a non-SMART meter, even for companies that have some older technology that's still in date, will vanish in the future.
the Wiring Regulations ought to reflect this to make more accurate, data-driven assessments of MD
BS 7671 does not specify what means is used to identify 'maximum demand', so I don't see a need to change BS 7671.
I would, however, bring out the following points:
So, in summary, I think:
(a) BS 7671 has appropriate requirements in its current form;
(b) the main smart meter might be able to be used to provide the 'maximum demand' for the distributor (taking into account any changes being made to the installation, see point 4 above); and
(c) meter data alone can't be used to rate circuits and equipment in the installation according to BS 7671 ... there's more than one 'maximum demand' for an installation ... or at least different parts/components forming it.
That feels like a statement that "maximum demand" is too poorly defined to be of any meaningful use. Not only is it not defined temporally (1msec, 1sec, 1min, 10min 30min, 1hr, 2hr, 5hr?) bit it is also not defined positionally in an installation. How is anyone expected to enter a figure on any document?
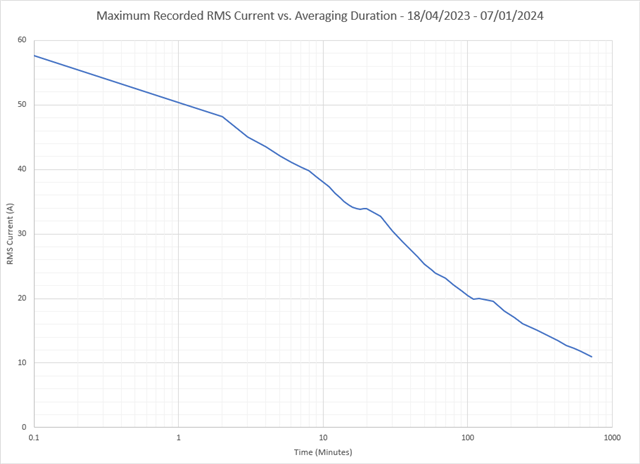
When I was having a discussion with the DNO about MD for my own property I had the ability to provide a graph of maximum RMS current vs. duration which seemed to be a lot more meaningful but very few people will have that granularity of metering.
Just to add, note that some DNOs explicitly permit a short term demand of up to 100A on installations fitted with an 80A fuse - who knows what an electrician is expected to write on an EICR in that case...
Given the fusing curves, they don't really have a choice, if you think the company fuse is the only current limiting object they have at their disposal.
Actually its not a bad fit to reality in terms of overheating meter tails and things either - the cable does not instantly combust at a 20% overload, rather it slowly heats up over several minutes eventually reaching a new equilibrium temperature, that is a bit above further above ambient, than that intended for meeting the full lifespan prediction in an ambient of 30C. That time constant is very long for transformers and buried cables and shorter for things with less thermal mass.
If the ambient is below 30, or the overload ceases before it even reaches that state, it may not be even stressed in terms of life reduction.
It is after all quite possible to wire a shower in 2.5mm2 cable and see it last for many years, despite the horrendous overload, on paper, until someone visits who takes more than ten mins at a time in the shower ;-)
Regards Mike.
That feels like a statement that "maximum demand" is too poorly defined to be of any meaningful use. Not only is it not defined temporally (1msec, 1sec, 1min, 10min 30min, 1hr, 2hr, 5hr?) bit it is also not defined positionally in an installation. How is anyone expected to enter a figure on any document?
I'm not sure about that ... just that the maximum demand of an installation according to the DNO or meter operator, and the smart meter readings, are not necessarily the same as the maximum demand according to Regulation 311.1, and this in turn may or may not lead to the necessary parameters to specify a piece of equipment at that point - say a consumer unit or distribution board.
maximum demand according to Regulation 311.1
Thank you for the reminder, Graham.
So there is nothing new about maximum demand, it is just that there is now a place for it on the model EICR form.
Of course, if the original EIC still exists, there is no problem. If an EVCP has been added, there will be an EIC for the new circuit, but there could be difficulty if the maximum demand is already at or close to 100 A. I suppose that is where load curtailment comes in.
BS 7671 does not specify what means is used to identify 'maximum demand', so I don't see a need to change BS 7671.
I would, however, bring out the following points:
I'm not sure I follow the logic, if the BS7671 does not specify how 'maximum demand' (MD) should be determined, but then as you point out and as we are discussing, there are quite a number of technical considerations which require proper consideration, to me, that would suggest that the methods and considerations for determining MD, would benefit from some form of document/guidance or other supporting information on the proper method for its calculation / estimation.
Smart meter consumption is recorded as an average over a time period, which could be half an hour (half-hour values), or could be as little as 10 minutes (10-minute values). These values are likely to be adequate to cite the 'maximum demand' required by the distributor for their stated 'maximum demand', but they are not necessarily adequate to rate a circuit, specify a protective device, or rate a consumer unit, etc, according to BS 7671.
The smart meter records energy import/export across the boundary, within the settlement period, which in Britain is currently a half-hour period, which can if deemed appropriate be converted to an average power demand for the half-hour period.
Buried with the SMETS standards there are some true MD type measurements, but I'm not aware if they are being used. Certainly the data is not accessible to the average consumer or electrician currently.
Some meters only record 'direct feeding' power, i.e. that supplied by the grid to the installation. And even if the meter records both 'direct feeding' and 'reverse feeding' power, it won't tell you whether there are loads in the installation that are consuming when the installation is reverse feeding. If there are local generation sources (PV, battery, V2G) then meter data alone (regardless of where the meters are) won't necessarily permit you to see where power is going in the installations ... i.e. if there are certain 'hot spots' of thermal load ... but see also second point above.
The 'smart meter' or more accurately the 'Boundary Point Settlement Meter' is measuring the active import or export energy flowing between the site and the electricity system, so yes that meter only "sees" the energy flows across that boundary. If there is additional sub-metering within the installation, then combining the boundary settlement metering data, with the internal sub-metering data, you could then estimate the internal power demand within the installation, but that depends on what sub-metering is available.
(a) BS 7671 has appropriate requirements in its current form;
What is lacking is the structure/guidance/method to ensure consistency in how MD is determined, given potential for different approaches in how to determine that value.
(c) meter data alone can't be used to rate circuits and equipment in the installation according to BS 7671 ... there's more than one 'maximum demand' for an installation ... or at least different parts/components forming it.
Quite, and given this complexity and potential for different values is, I would suggest, why something like a guidance note, or supporting document, or even something like a good article in Wiring Matters would be useful.
I would also argue that this is not merely a trifling, or academic matter, as millions of homes install new loads like EV charge points, heat-pumps, home batteries etc, what the "true" or accurate MD is for a property will have very significant financial impacts for Britain (hundred of millions, maybe even billions) in terms of needs to upgrade consumer installations and the DNO supply to people's properties.
Going forward MD is arguably an important topic that deserves more attention.
the methods and considerations for determining MD, would benefit from some form of document/guidance
Such as Appendix A of the On-Site Guide.
An average of 10 kWh/day is high consumption, but it could be half as much in summer and twice as much in winter. Let's be extravagant and go for 24 kWh/day in cold weather. If it is consumed over 16 hours, that is 1.5 kW.
If the maximum demand is 23 kW, that would be 15 times the average, which seems a very peaky graph.
I suspect that until you get an EV, heat pumps, and an instantaneous shower, you have nothing to worry about.
Hi,
But what time duration is used to calculate "maximum"?
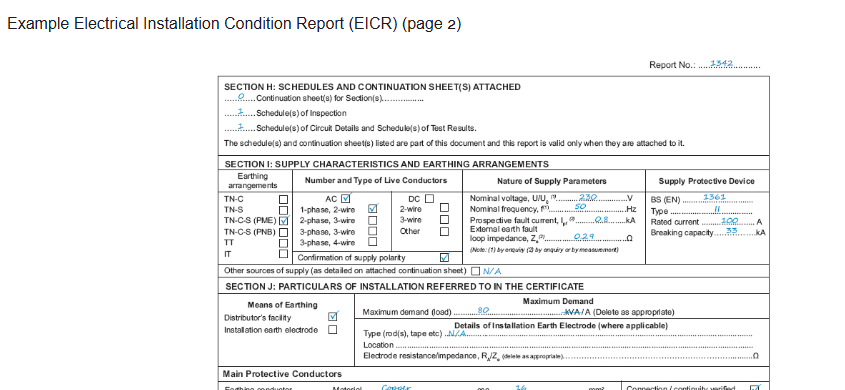
To take some data I have for my own property, what is the MD here?
At the time this data was recorded there was a 60A DNO fuse.
For those who want to attempt an answer based on the OSG guidance, there was a CU with breakers as follows:
Shortly after the data was recorded the DNO fuse was changed to 80A - did that change the MD?
After the 80A fuse was fitted, a 32A car charger was installed - is the MD 80A? Did the car charger need to incorporate load limiting or could a MD of 70A, including the charger, have been declared based on the 10 minute maximum RMS without any limiting?
Is using the recorded data sensible? The usage reflects my lifestyle - someone else living with the same electrical installation might have a very different MD.
I'm happy to use engineering judgement to answer the above questions but I suspect that there won't be a single right answer to each...
I'm happy to use engineering judgement to answer the above questions but I suspect that there won't be a single right answer to each...
Agreed, 100 %.
Shortly after the data was recorded the DNO fuse was changed to 80A - did that change the MD?
Not necessarily, but it might affect the InA rating you ought to select for a consumer unit to BS EN [IEC] 61439 series if you install microgeneration such as PV and/or energy storage.
representing the power over time as a cumulative probability density like that is actually a very helpful method.
One can then draw lines of constant time (vertical) or for things like heating cables or fuse-links lines of constant I2t and compare, as well as breaker curves. (the time constant for an oil filled transformer being some hours, and for buried cable at least half an hour.)
In terms of thermal stresses this representation shows the worst case - in reality often a burst of high power will not be followed by a burst of only slightly lower power, but by a lot less, allowing for some cooling down.
But, it would be quite fun to overlay that with a C type breaker curve, and see that your whole house could just about manage on a 32A breaker and certainly a 40A one I think. I'm not too sure about that, as the area under the curve does not seem to integrate to the 9 months I was expecting. But that is probably my failing to grasp some subtlety.
Mike..
Hi,
The graph doesn't represent all the data - it is constructed by taking 1 minute RMS data and then using that to calculate the RMS for 2, 5, 10, 30, 60, 90, 120, etc. minute blocks with each minute at the centre over the 9 month period. The greatest value for each duration is then plotted on the graph. The metering I am using also measures a "maximum" value for the minute - I'm not sure what time that is measured over so I plotted that at the 0.1 minute point for convenience.
As you note, the graph doesn't give any indication of cool down time (other than an absolute worst case) - there is no guarantee that, for example, the 90 minute RMS figure and the 120 minute figure are from overlapping measurement periods.
It is also useful to pick an RMS averaging duration and plot frequency against current - that is helpful if you know exactly which averaging duration you are interested in (and would represent the whole data set). I suppose a pretty 3D surface could be plotted if you wanted to see all averaging durations against frequency at once - I'll have a go one day if I have spare time.
I see, yes- and also there will of course be really short inrush events with peak currents many times all of that - but as these are just the motor start for the fridge or the flat capacitor of the LED lights charging at switch on, while it may be 100A plus, it won't last long enough to trouble the score in terms of tripping or cable heating.
I can also see a variation of that sort of representation being very useful for cable ageing studies - possibly using I2 rather than I as the vertical quantity.
Mike
A meter at a property in working at tell you what I presume is the maximum demand on its screen.
We're about to take you to the IET registration website. Don't worry though, you'll be sent straight back to the community after completing the registration.
Continue to the IET registration site

